The licensure process is designed to help candidates build their knowledge, skills, and abilities in areas of architecture that are essential for protecting the public’s health, safety, and welfare.
Most candidates develop these competencies through a combination of education and experience. Typically, this includes earning a degree from a program accredited by the National Architectural Accrediting Board (NAAB) and completing the Architectural Experience Program® (AXP®). However, 16% of new architects in 2023—approximately 560 practitioners—chose to earn additional experience in lieu of earning a degree from a NAAB-accredited program.
Through our Pathways to Practice initiative, NCARB is working to expand access to licensure outside of the traditional 5-7 years of higher education required for a NAAB-accredited degree.
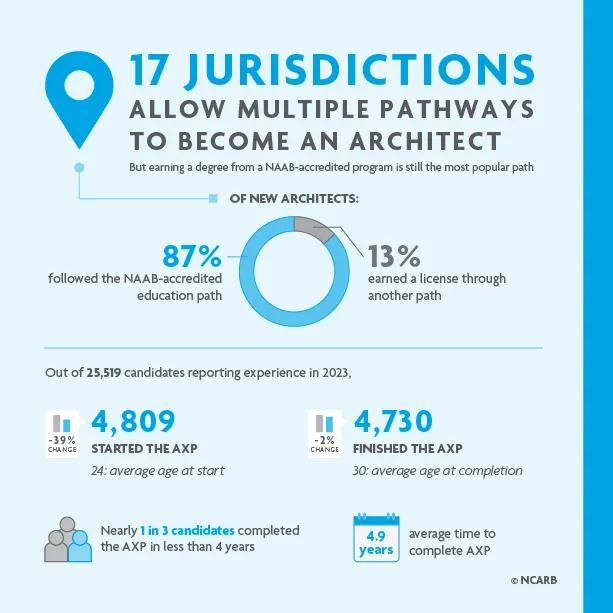
Nearly 5,000 candidates started reporting professional experience in 2023, and over 4,600 completed the AXP. Unlike the exam, which has largely recovered, the experience program has continued to show lingering effects of the COVID-19 pandemic.
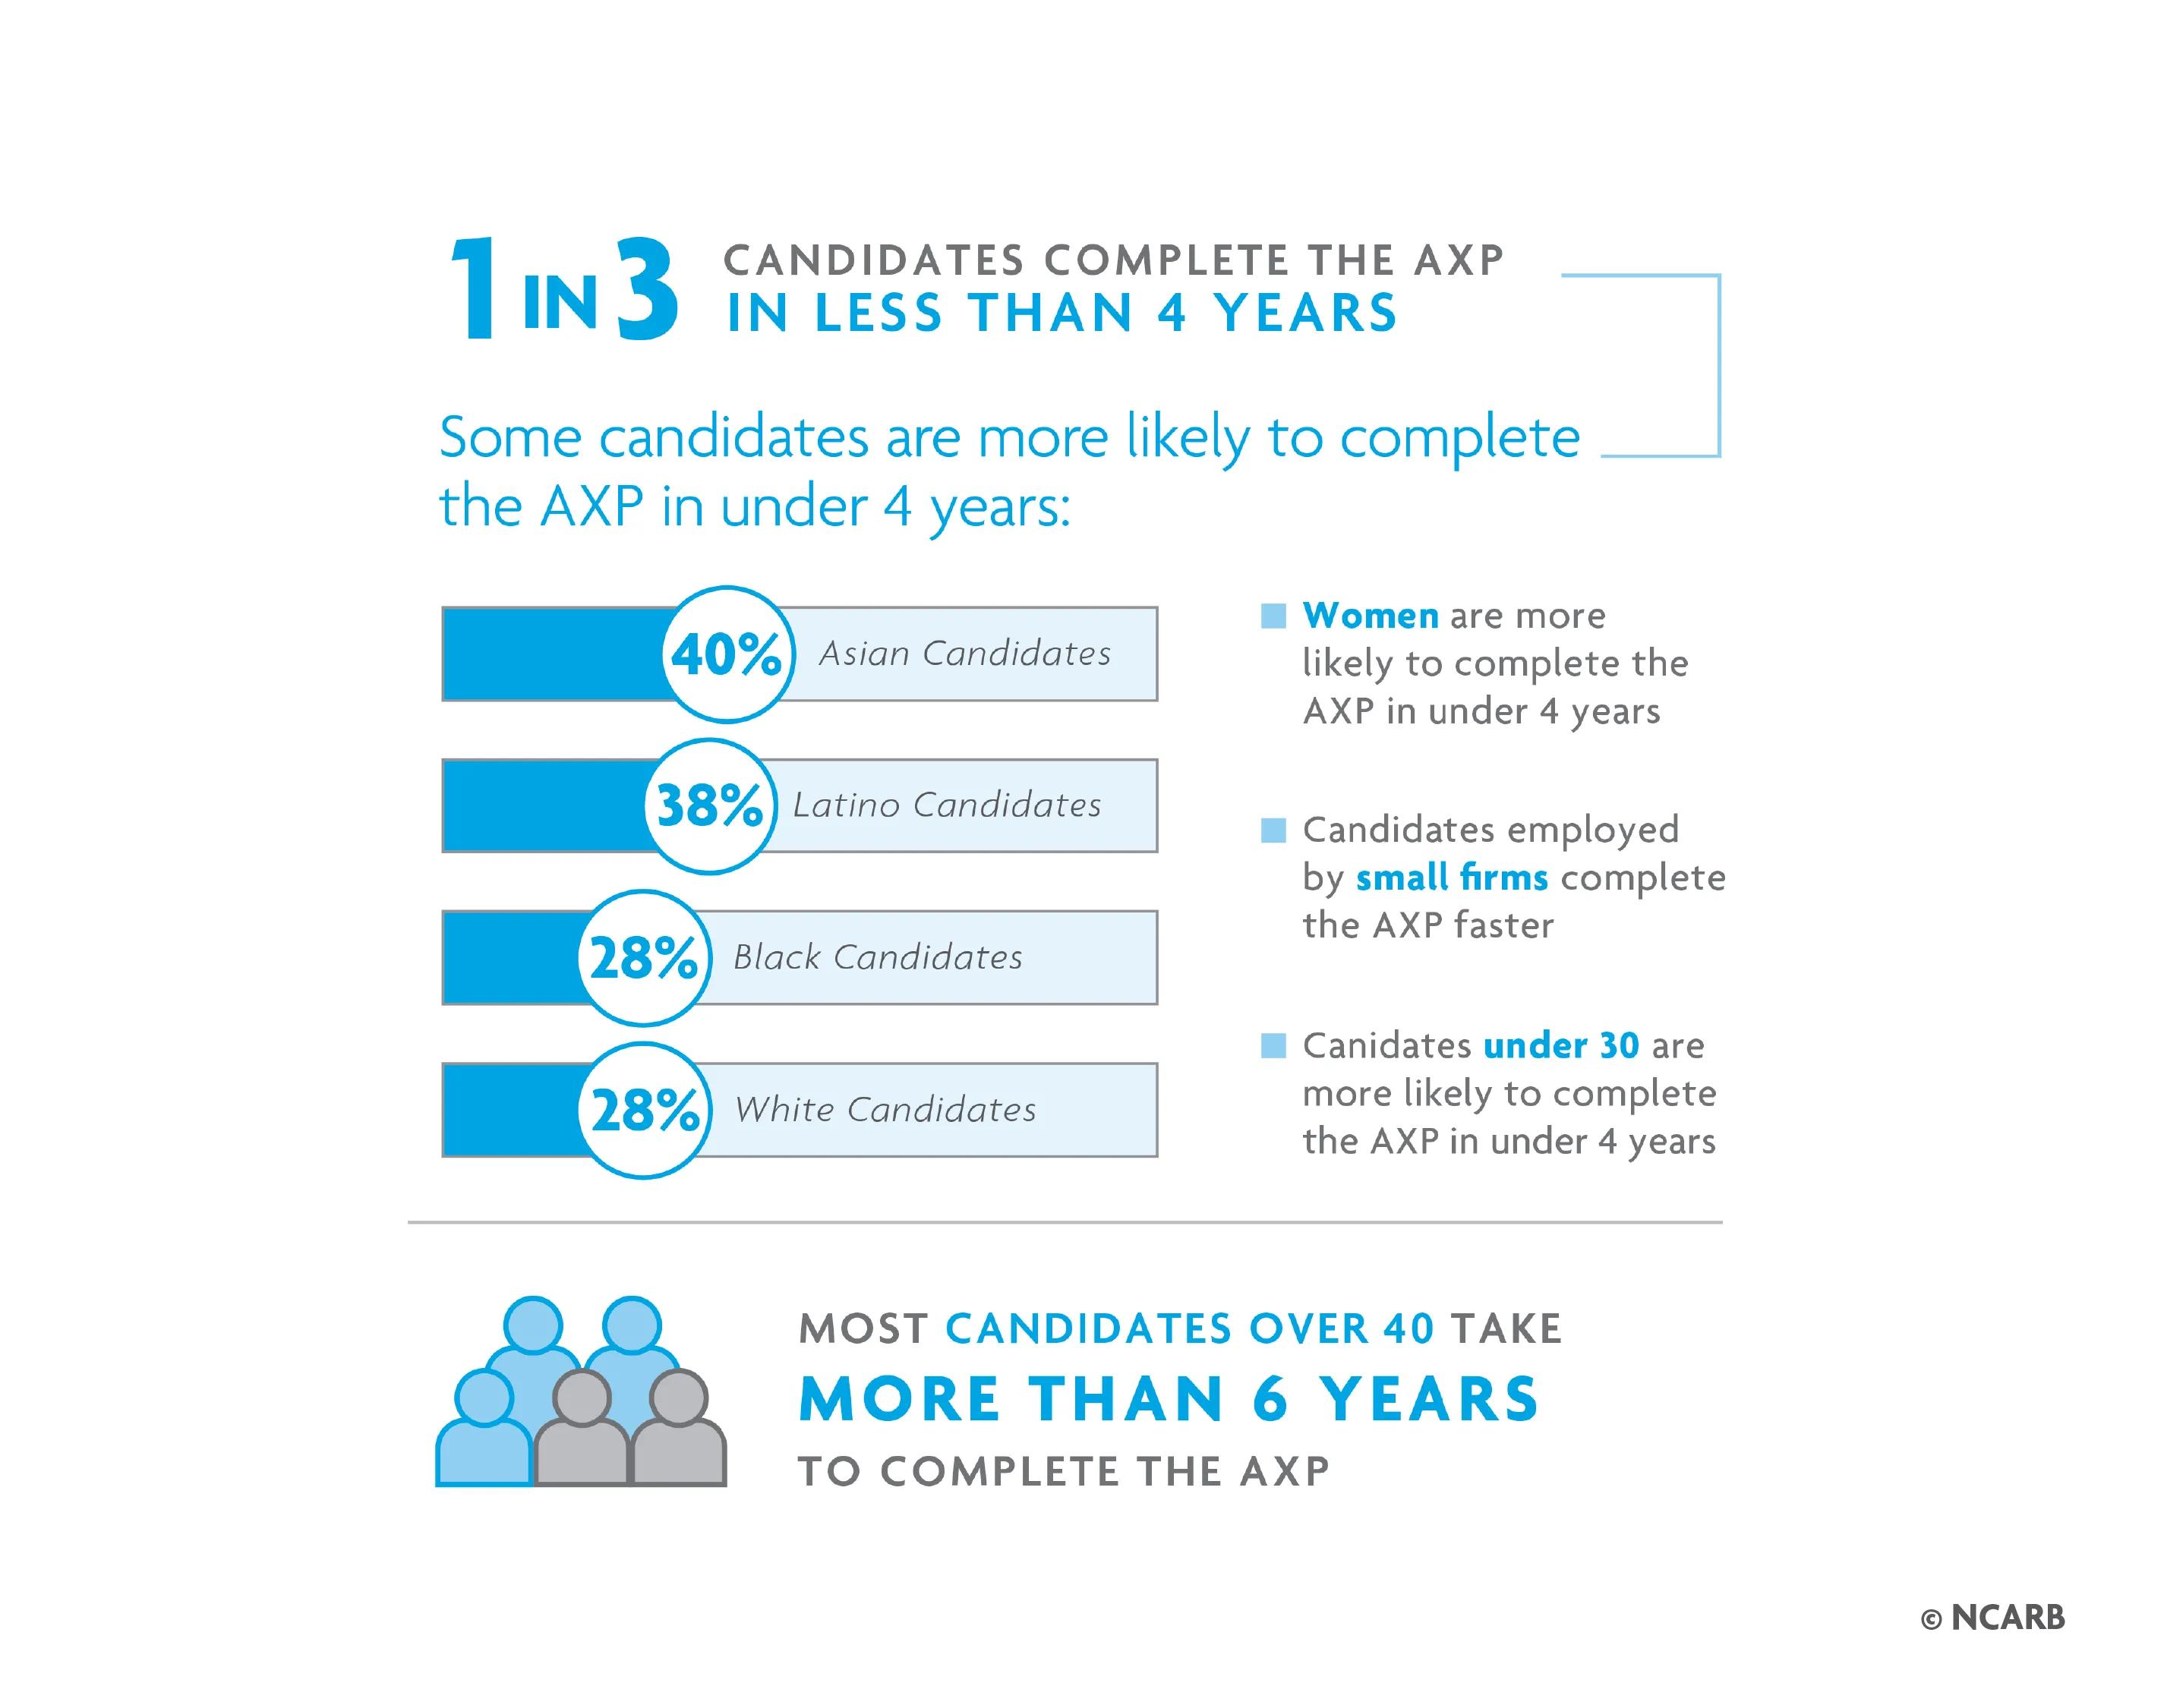
On average, candidates take nearly 5 years to complete the AXP. However, 1 in every 3 candidates finishes the program in less than 4 years, and women and people of color are even more likely to complete the AXP in a shorter time frame.
Over 30,000 students are enrolled in NAAB-accredited programs.
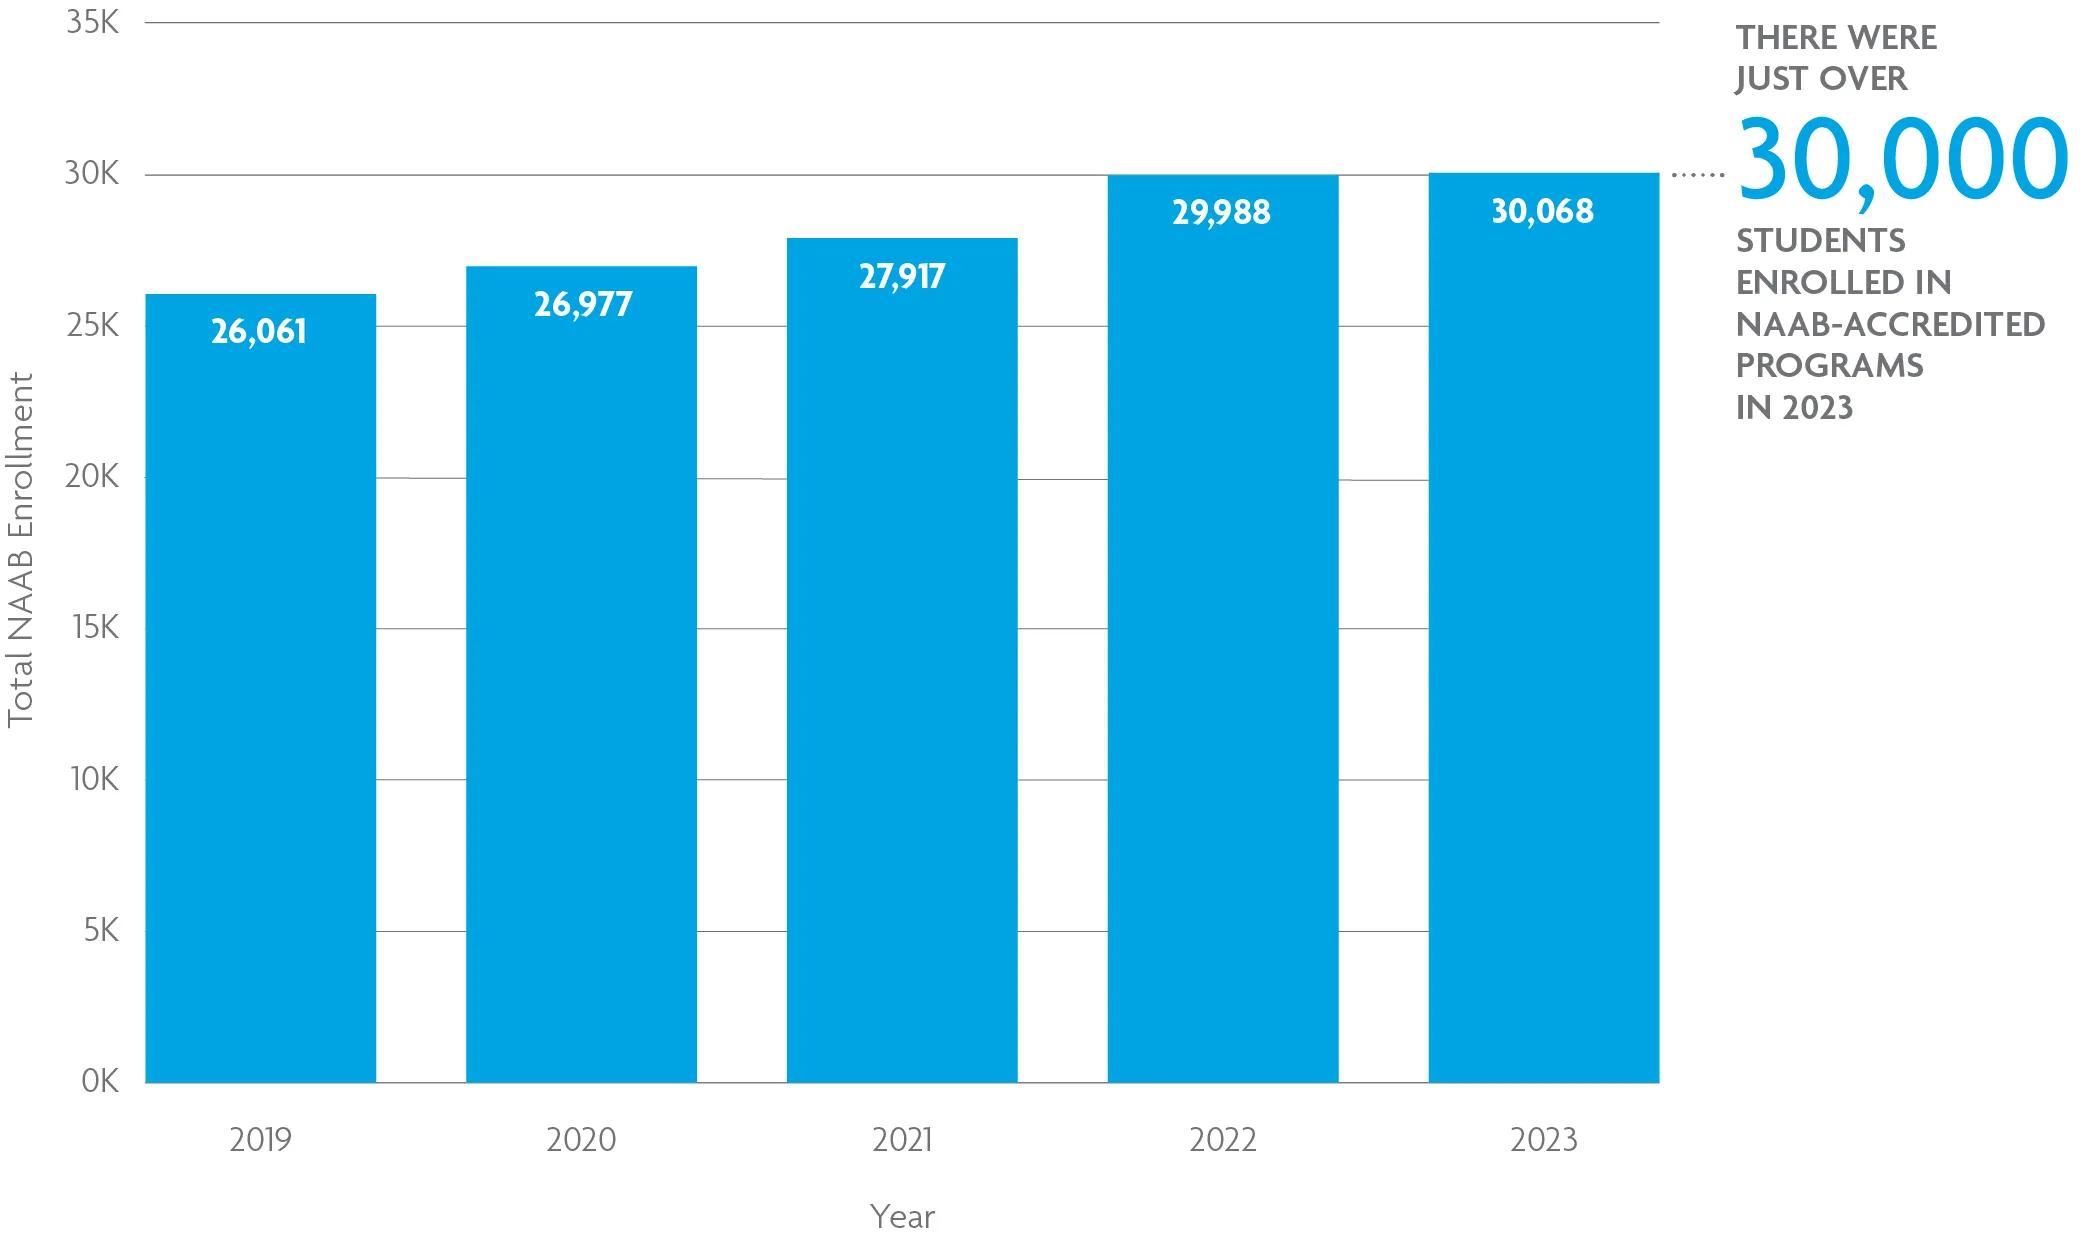
More than 30,000 students were enrolled in a NAAB-accredited program in the 2022-2023 school year, relatively the same number seen the year before.The total number of students enrolled in a NAAB-accredited program has been slowly growing over the past several years.
Of students enrolled in NAAB-accredited programs, 61% are enrolled in Bachelor of Architecture programs, and 39% are enrolled in Master of Architecture or Doctor of Architecture programs. Forty-six percent are men, 53% are women, and nearly .5% are non-binary.
Note: This data is provided to the NAAB by accredited programs and will be published in the 2023 NAAB Report on Accreditation in Architecture, available at www.naab.org. Students enrolled in non-accredited architecture programs are not represented.
Most new architects have a degree from a NAAB-accredited program.
Of the 55 U.S. jurisdictions, 38 require licensure candidates to have a degree from a program accredited by the NAAB. The remaining 17 jurisdictions offer multiple paths, including the typical NAAB-accredited program approach as well as allowing applicants to substitute additional experience in lieu of a professional degree.
Because most jurisdictions require a degree from a NAAB-accredited program, this is the most common path to earning a license in the United States—only 13% of new architects in 2023 pursued a different licensure path. Earning a degree from an accredited program typically takes 5 or 6 years of higher education, an investment of time and resources that not all aspiring architects can afford. In 2023, NCARB launched a new “Pathways to Practice” initiative, encouraging licensing boards to adopt additional licensure pathways that recognize the variety of education and experience backgrounds the profession has to offer.
NCARB hopes to see the educational backgrounds of new architects become more diverse in future years as new opportunities for demonstrating competency are developed.
However, adopting this kind of regulatory change can take months or years. And, even with other options available, NCARB anticipates most licensure candidates will continue to pursue a NAAB-accredited education.
In states with additional pathways, 20-30% of new architects don’t hold a degree from a NAAB-accredited program.
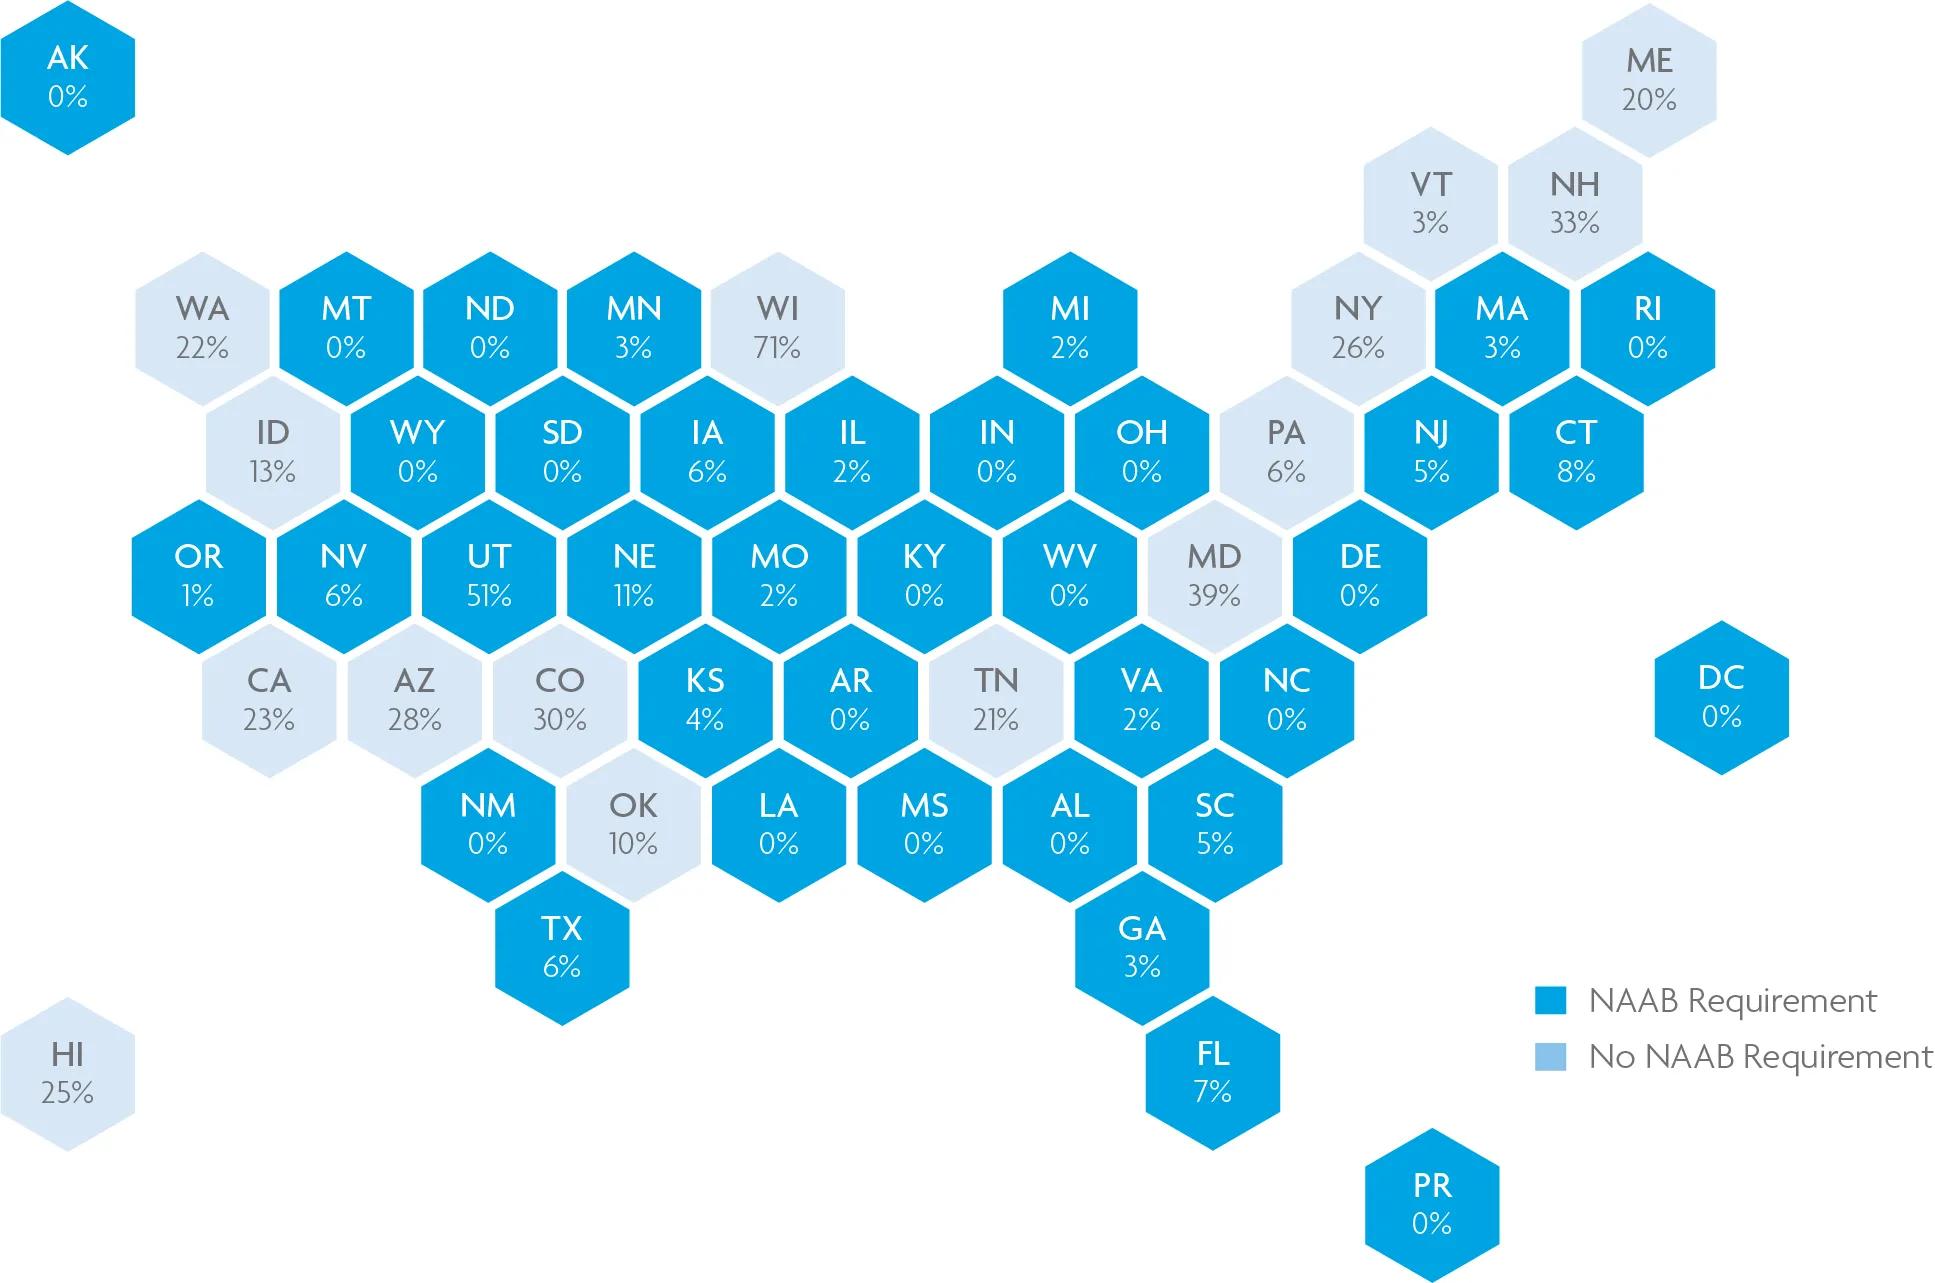
While the proportion of new architects across the U.S. who don’t have a degree from an accredited program is just 13%, that proportion is much higher in jurisdictions where a degree from a NAAB-accredited program isn’t required.
In many states that offer additional paths to licensure, 20-30% of new architects don’t hold a degree from a NAAB-accredited program. Note: some states that require a degree from a NAAB-accredited program still offer limited access to additional pathways.
As more states adopt additional pathways to licensure, NCARB hopes to see an increase in the number of new architects who follow non-traditional pathways.
60% of new architects graduate from public universities.
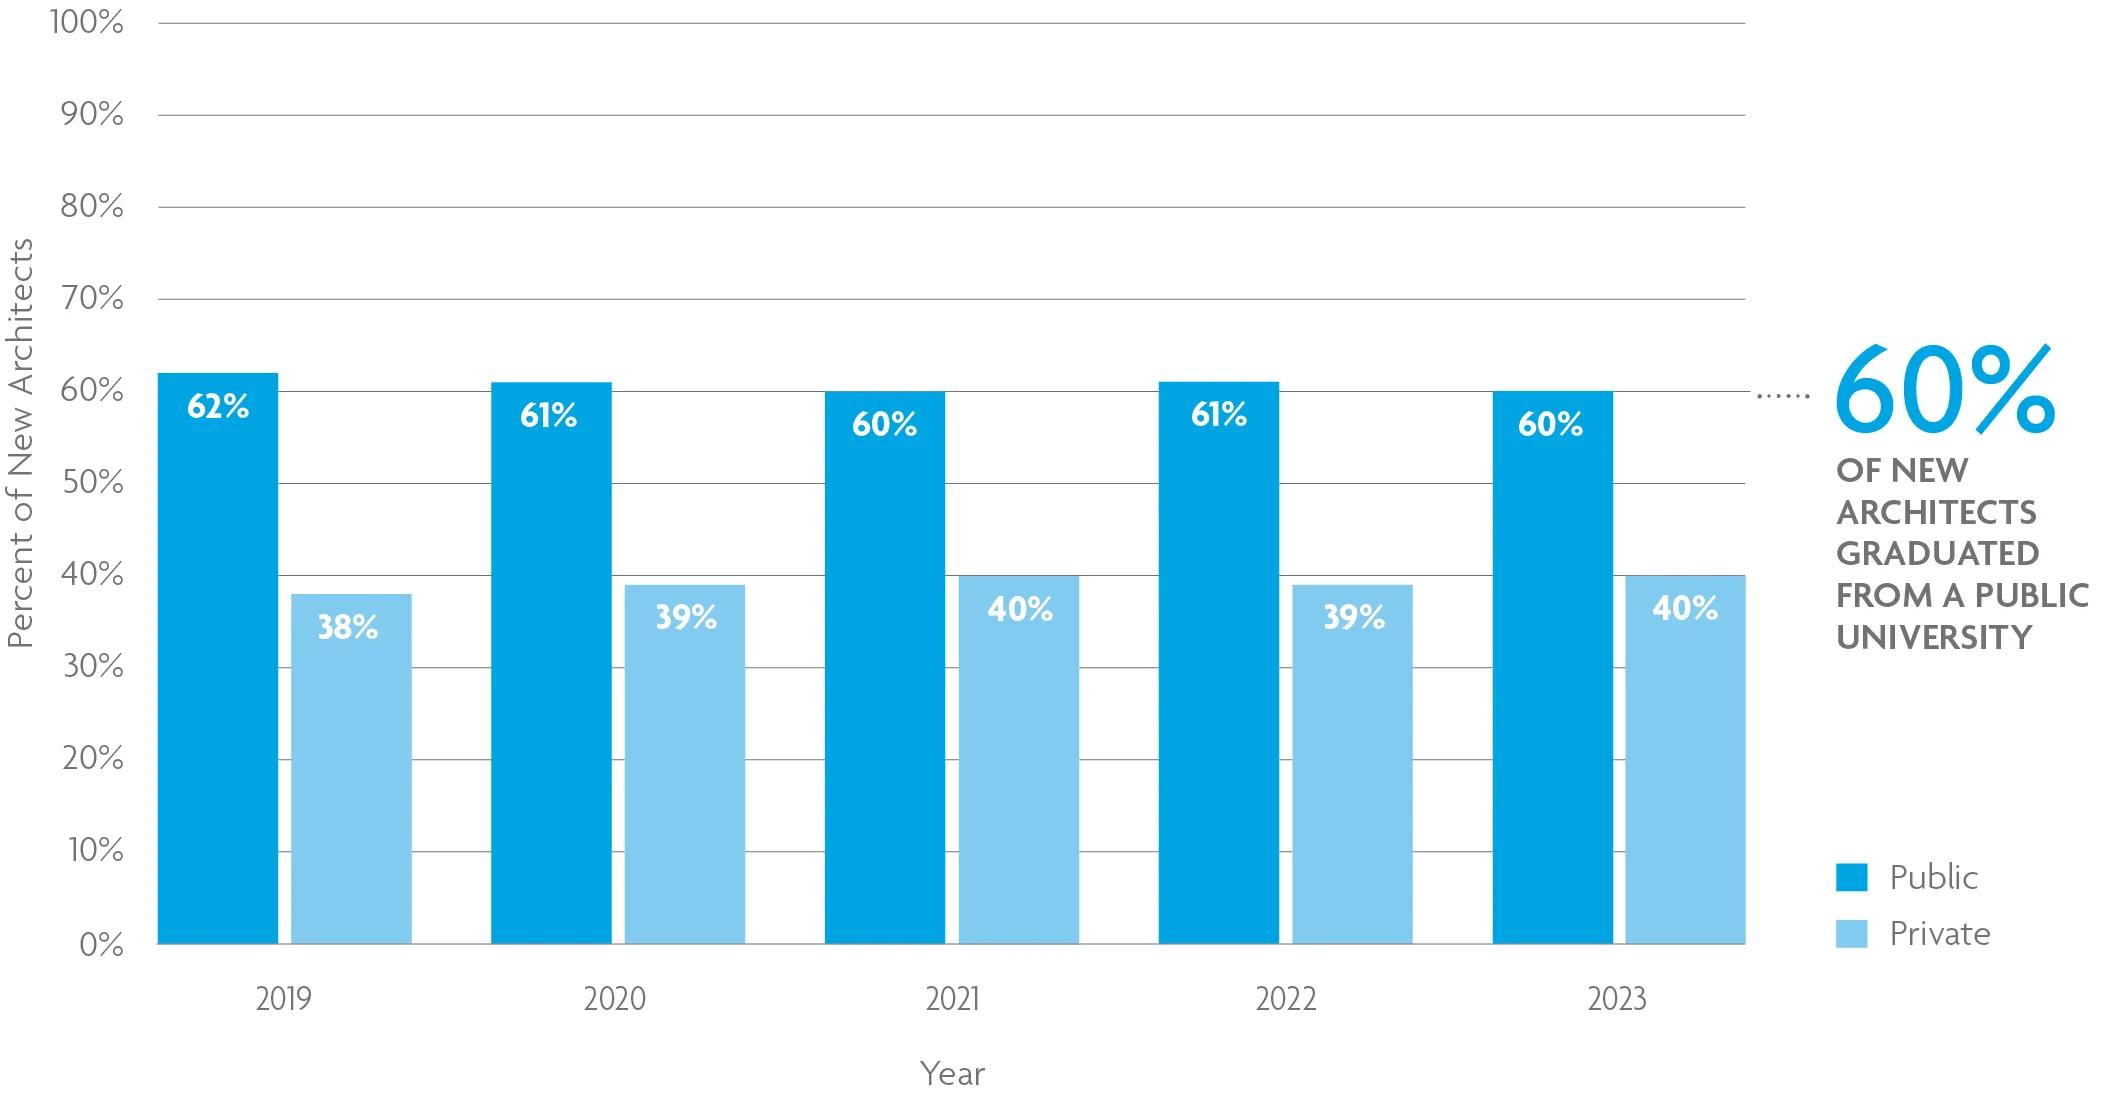
Most new architects attend public, rather than private, universities. The ratio of public to private has stayed relatively stable over the past 5 years, with approximately 60% of new architects each year attending a public institution.
This breakdown aligns with the makeup of NAAB-accredited programs: 59% of schools that offer NAAB-accredited programs are public institutions, and the remaining 41% are private.
The top four schools attended by architects who were licensed in 2023 were public universities:
- Virginia Tech (2.8%)
- The University of Oregon (2.6%)
- The University of Michigan (2.3%)
- Cal Poly (2.3%)
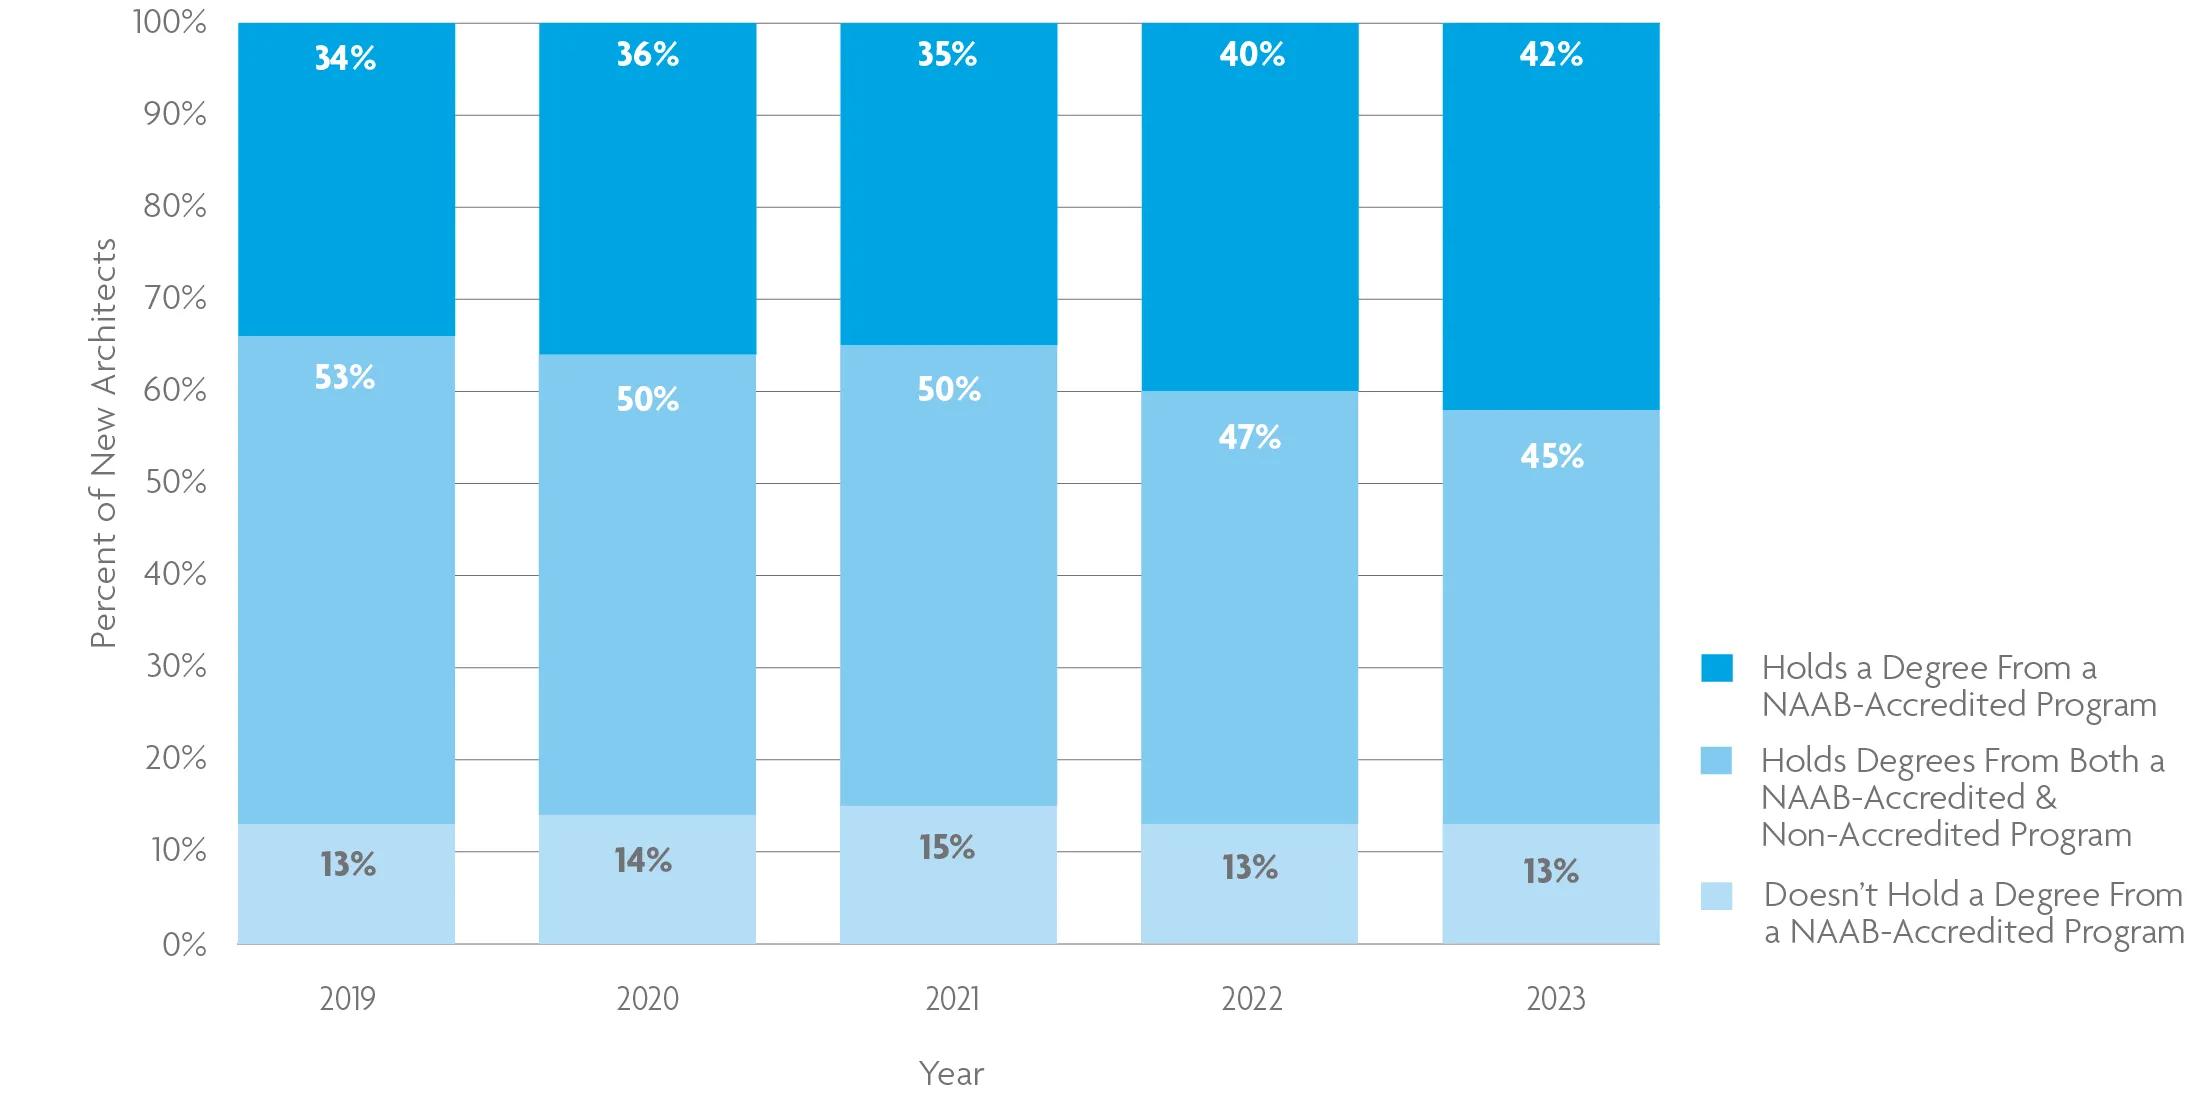
Over half of new architects have more than 1 degree.
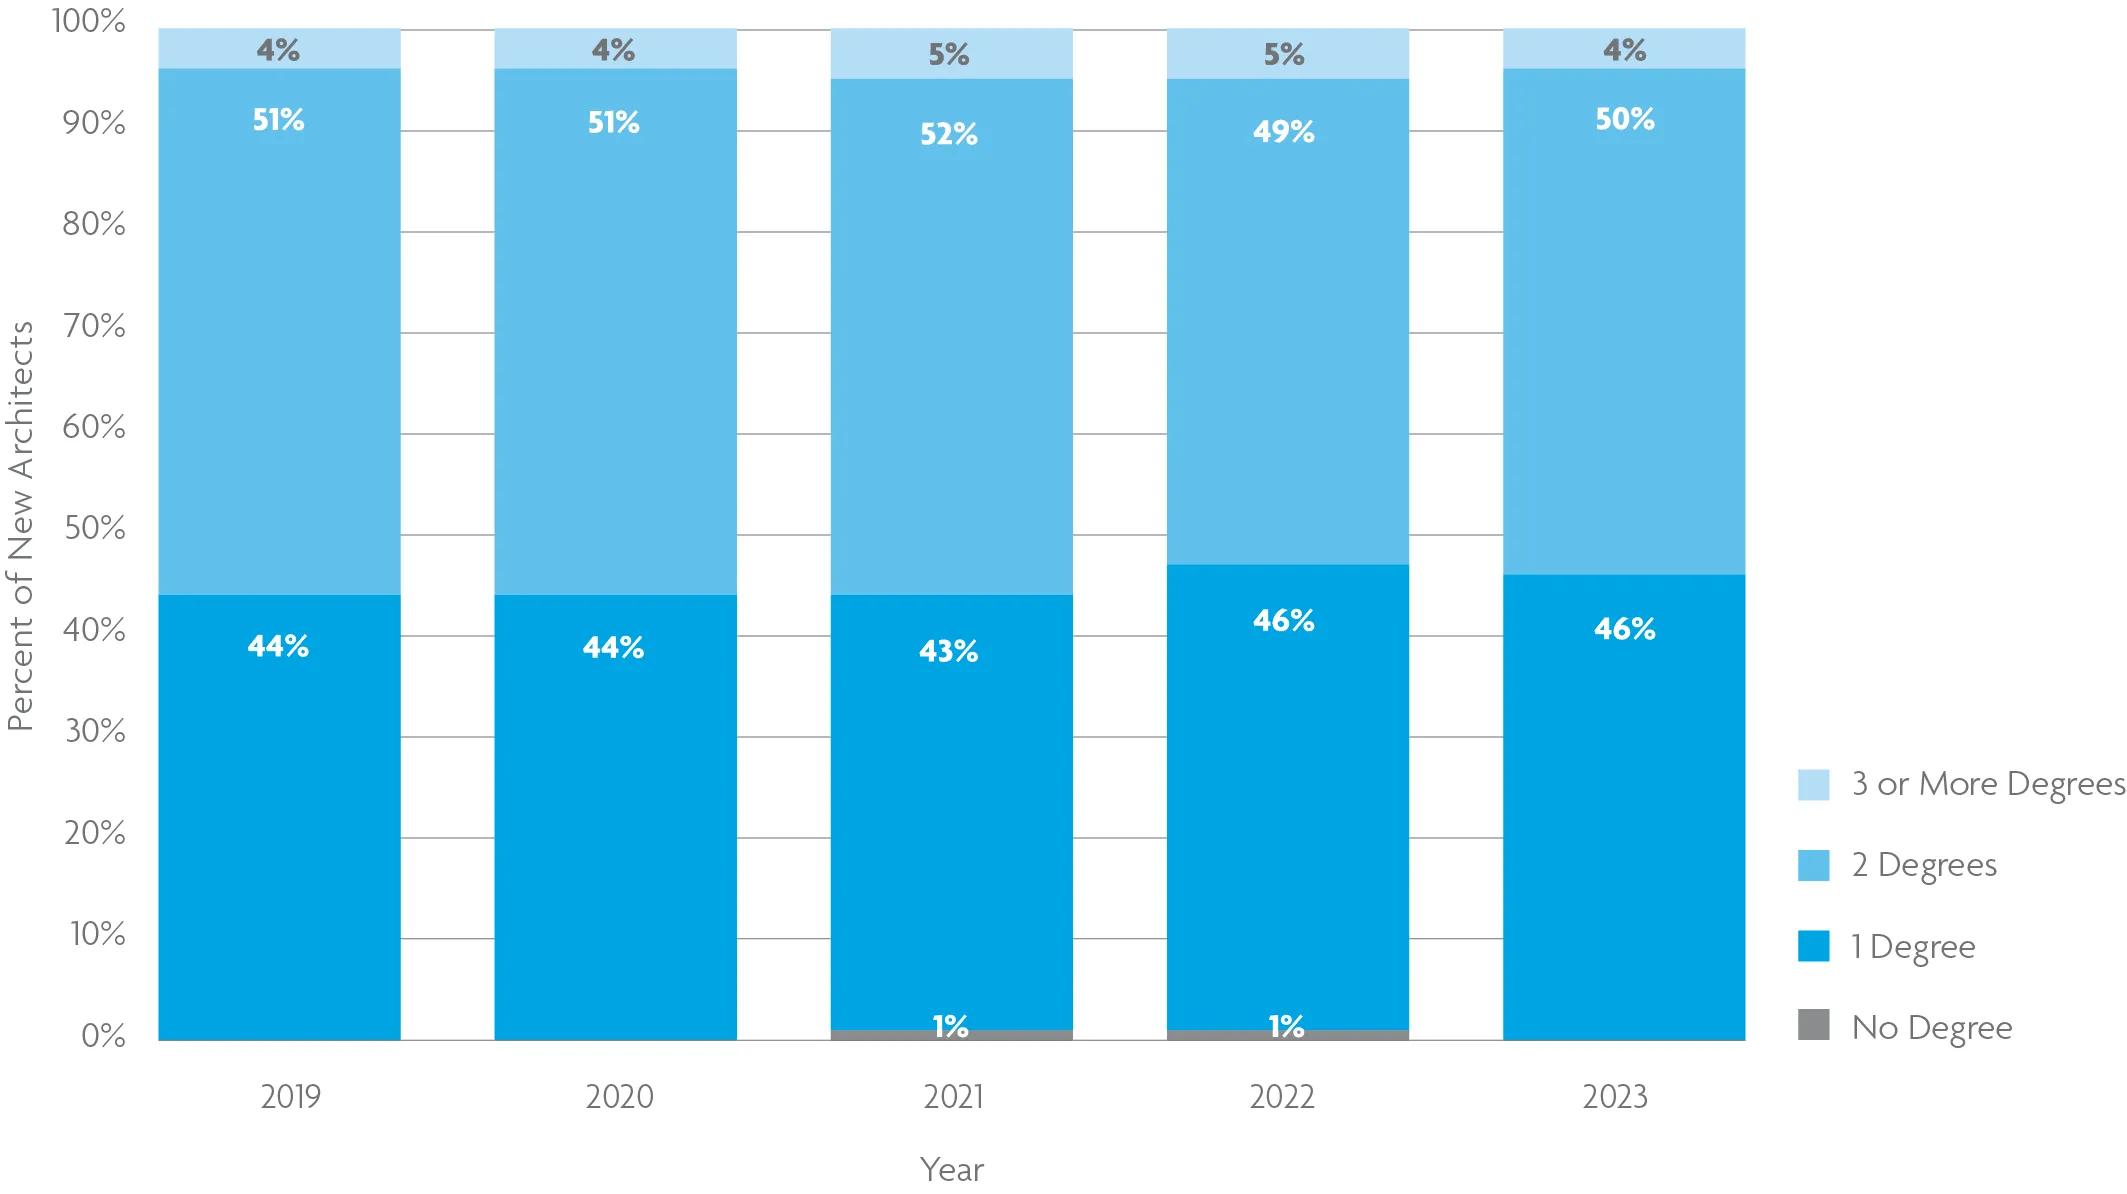
Educational trends in architecture have held steady over the years, with the majority of new architects holding more than one post-secondary degree. Of the roughly 3,500 architects licensed in 2023, 50% held 2 degrees, and an additional 4% held 3.
This aligns with NCARB’s data regarding the types of degrees held by new architects, with roughly 45% holding both a degree from a NAAB-accredited program and a degree from a program not accredited by the NAAB. For some, this approach is planned: many candidates intentionally attend a non-accredited bachelor’s program first and then complete their education at an accredited Master of Architecture program. But for others, holding multiple degrees stems from low awareness of accreditation requirements for licensure, with many candidates needing to return to school to earn a license in their chosen jurisdiction.
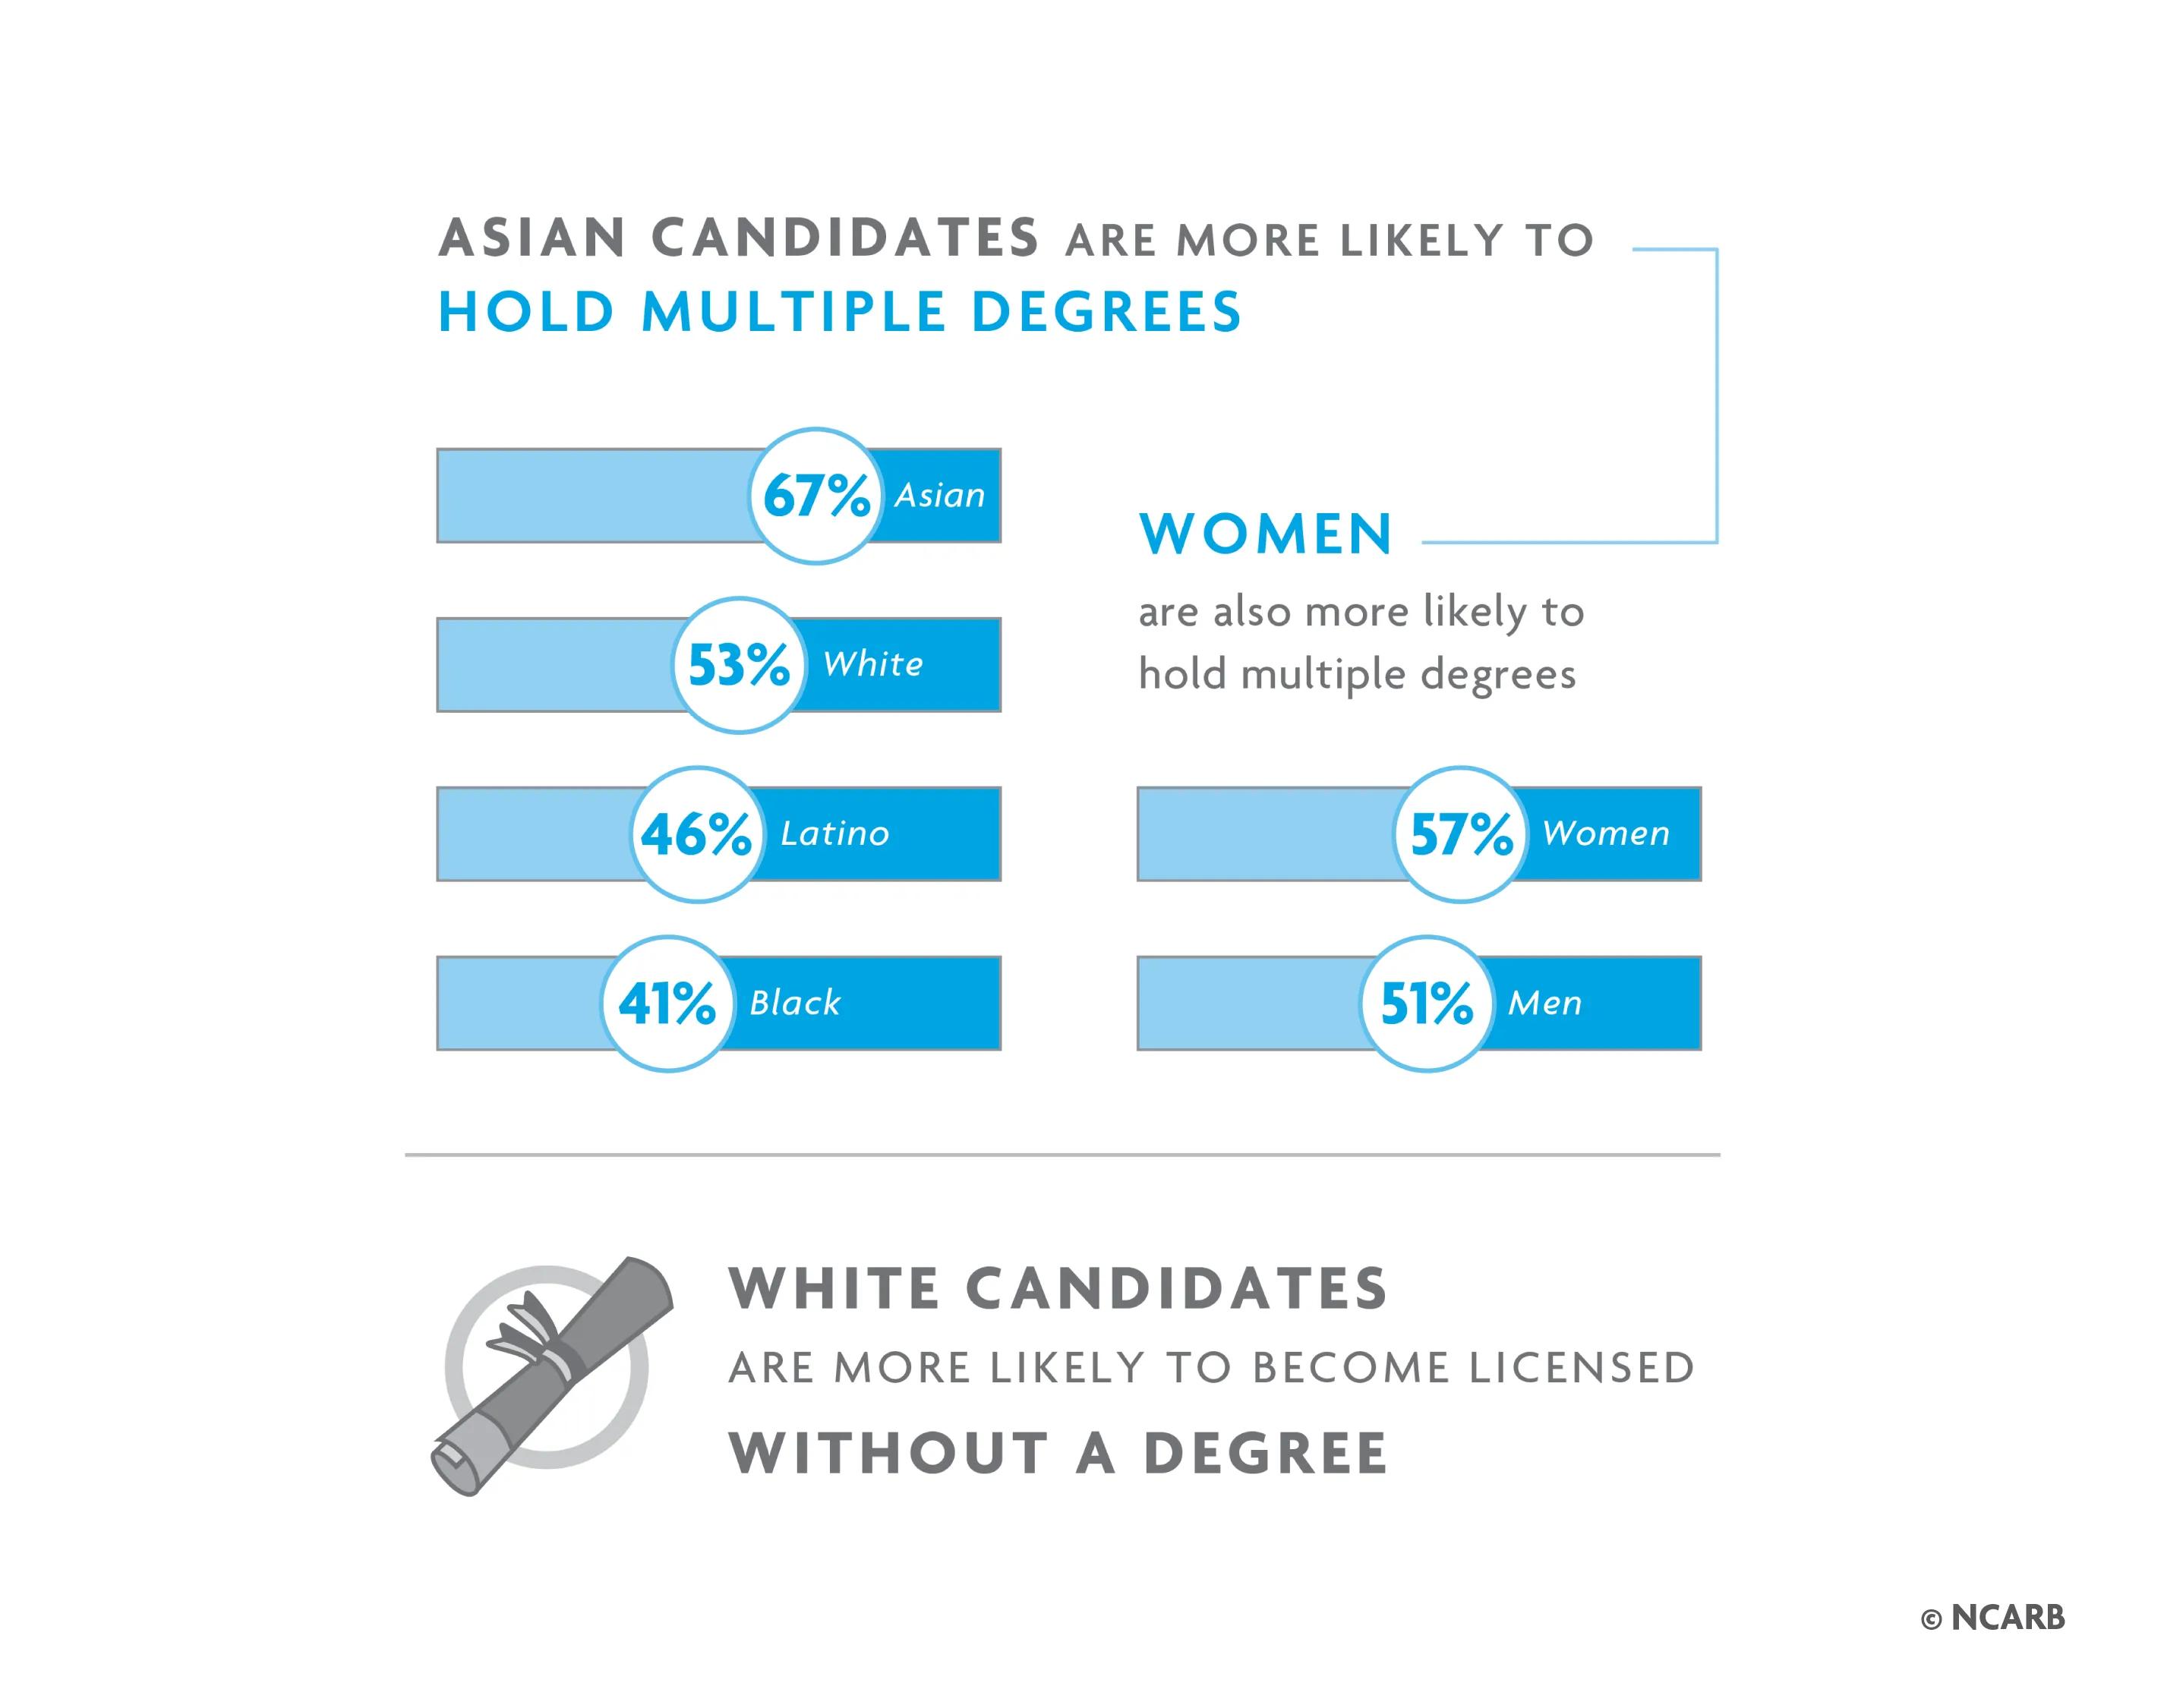
- People of color—especially Asian architects—are more likely to hold multiple degrees
- White candidates are more likely to become licensed without a degree
- Women are also more likely to hold multiple degrees
The Integrated Path to Architectural Licensure (IPAL) continues to grow.
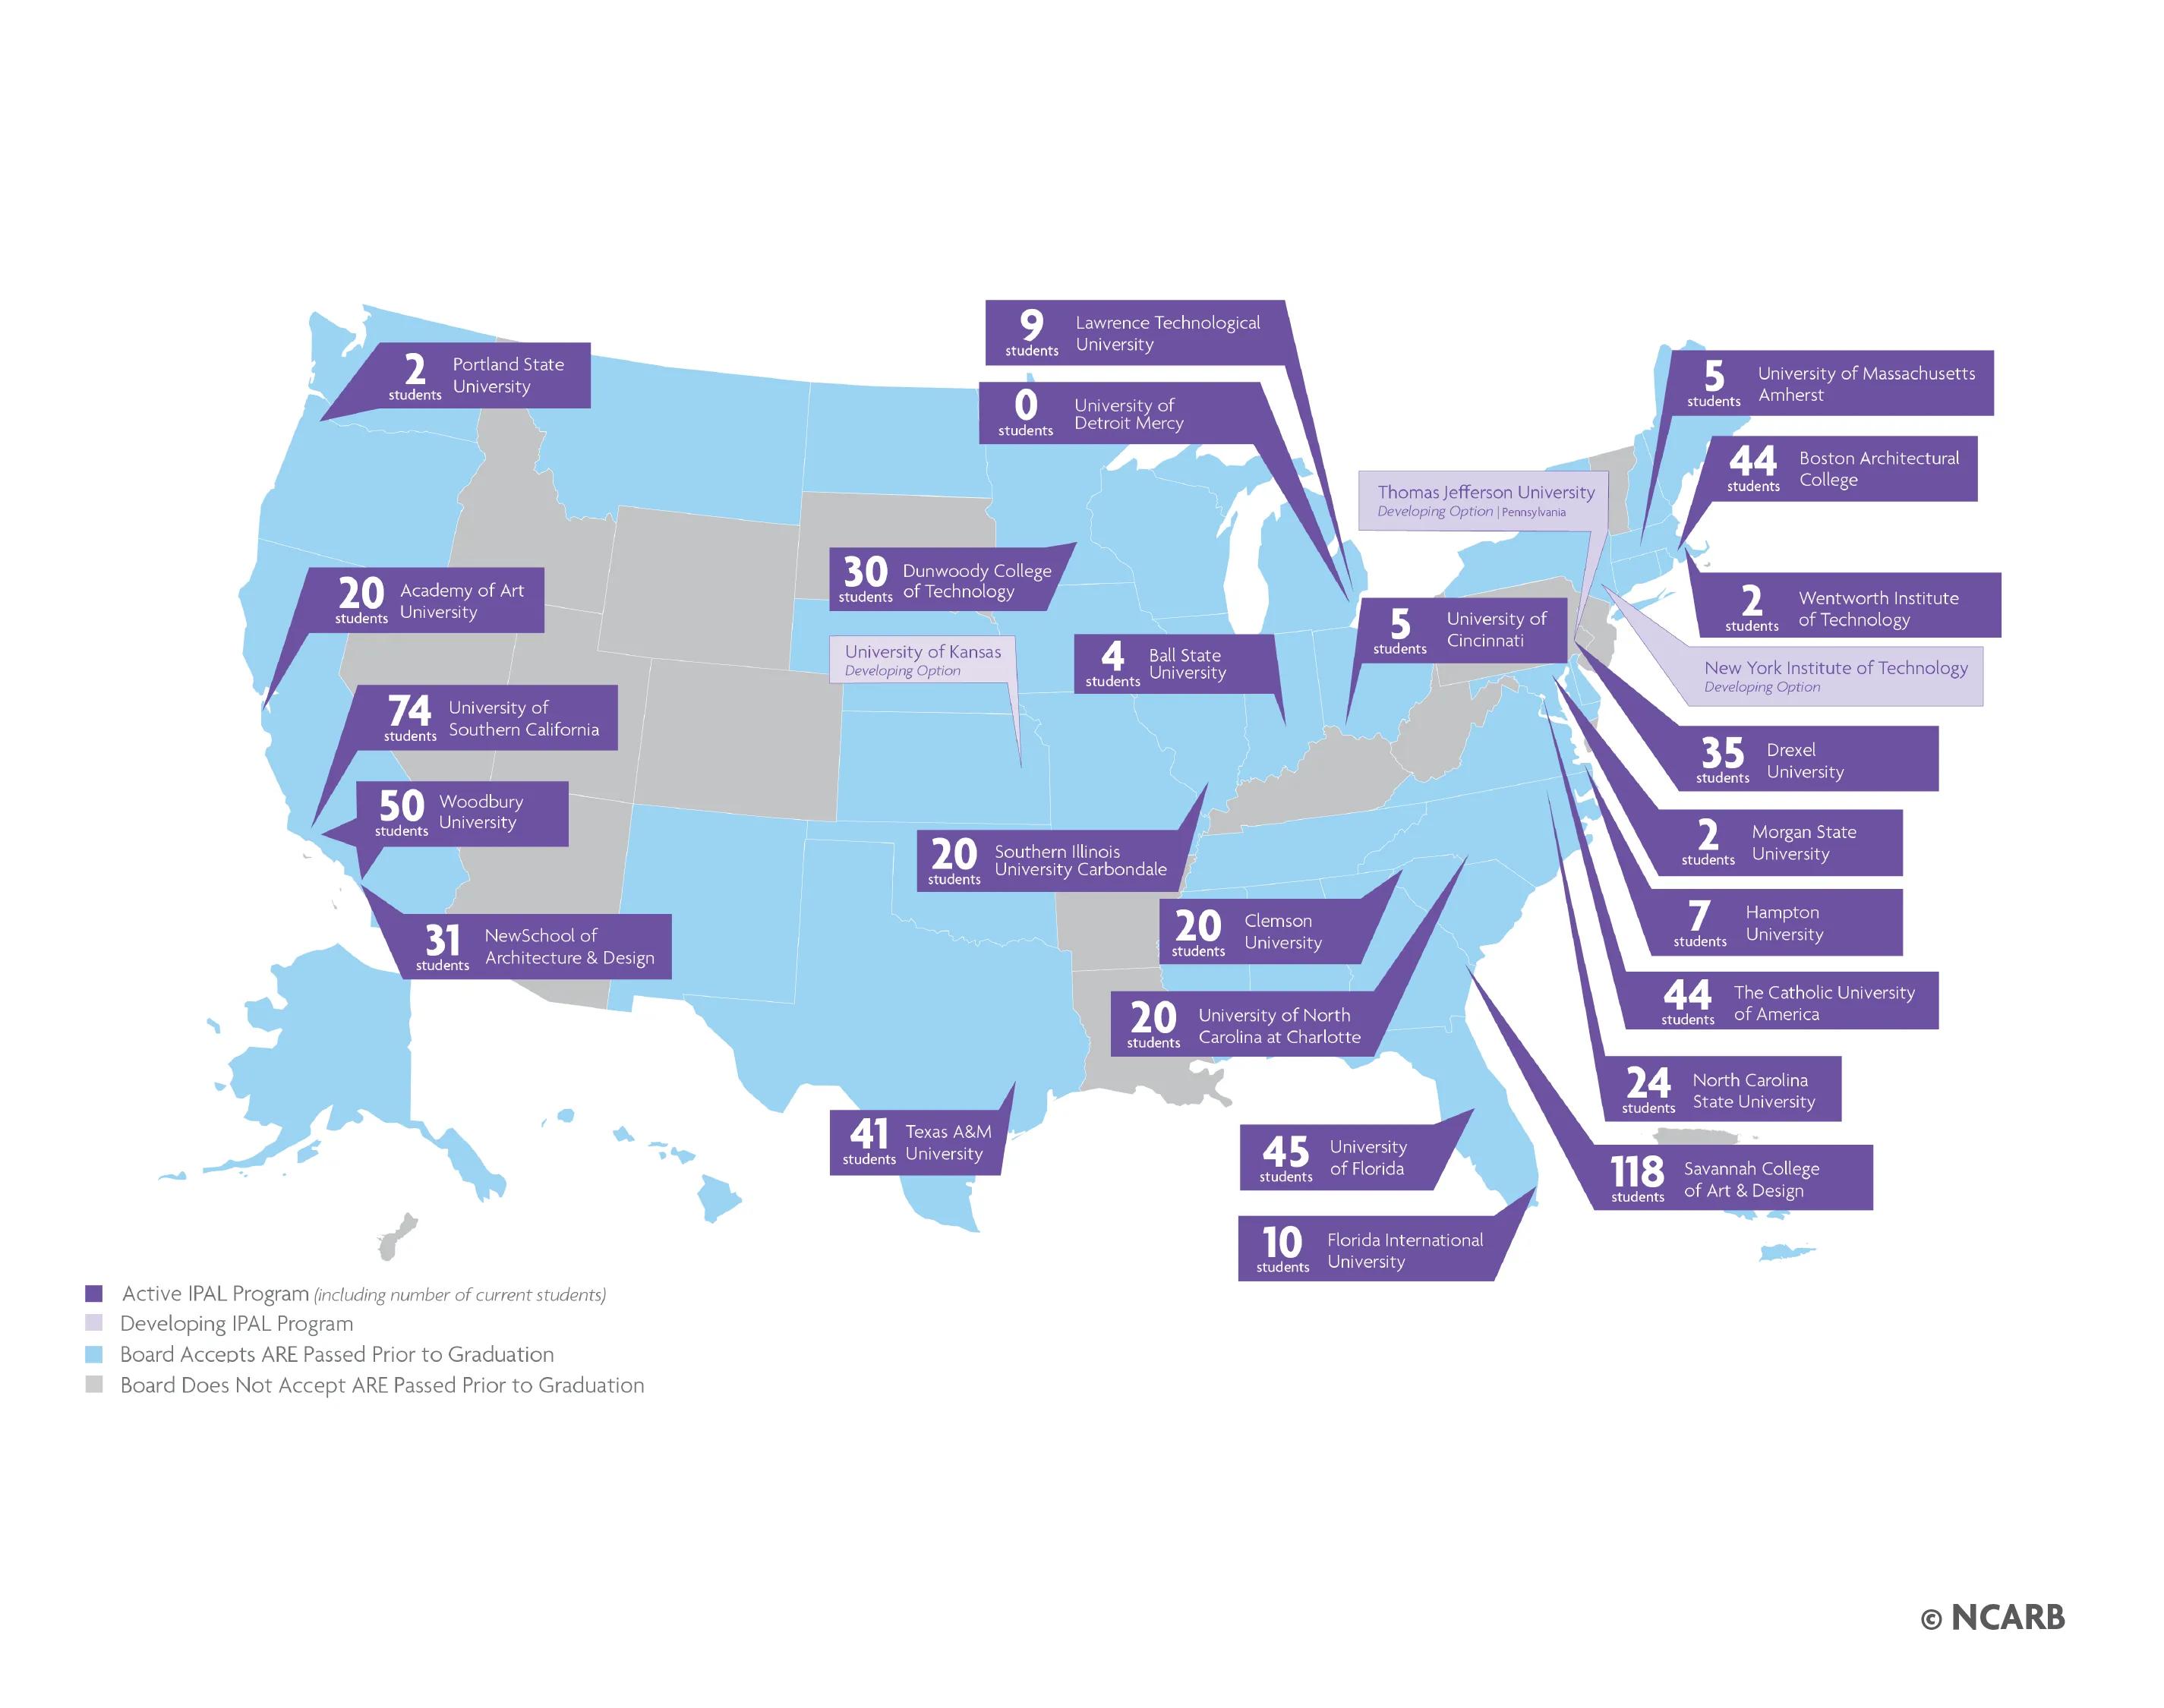
There are currently 33 programs at 28 colleges participating in NCARB’s Integrated Path to Architectural Licensure (IPAL) initiative, including several that joined in 2022 and 1 that joined in 2023.
The IPAL option—offered as an additional path within an existing NAAB-accredited program—seeks to shorten the time it takes to become an architect for students who have made earning a license a focus. Participating programs provide students with the opportunity to complete the AXP and take all six ARE 5.0 divisions prior to graduation.
During the 2022-2023 school year, over 650 students were enrolled in IPAL options across the United States.
AXP participation moves toward pre-pandemic levels.
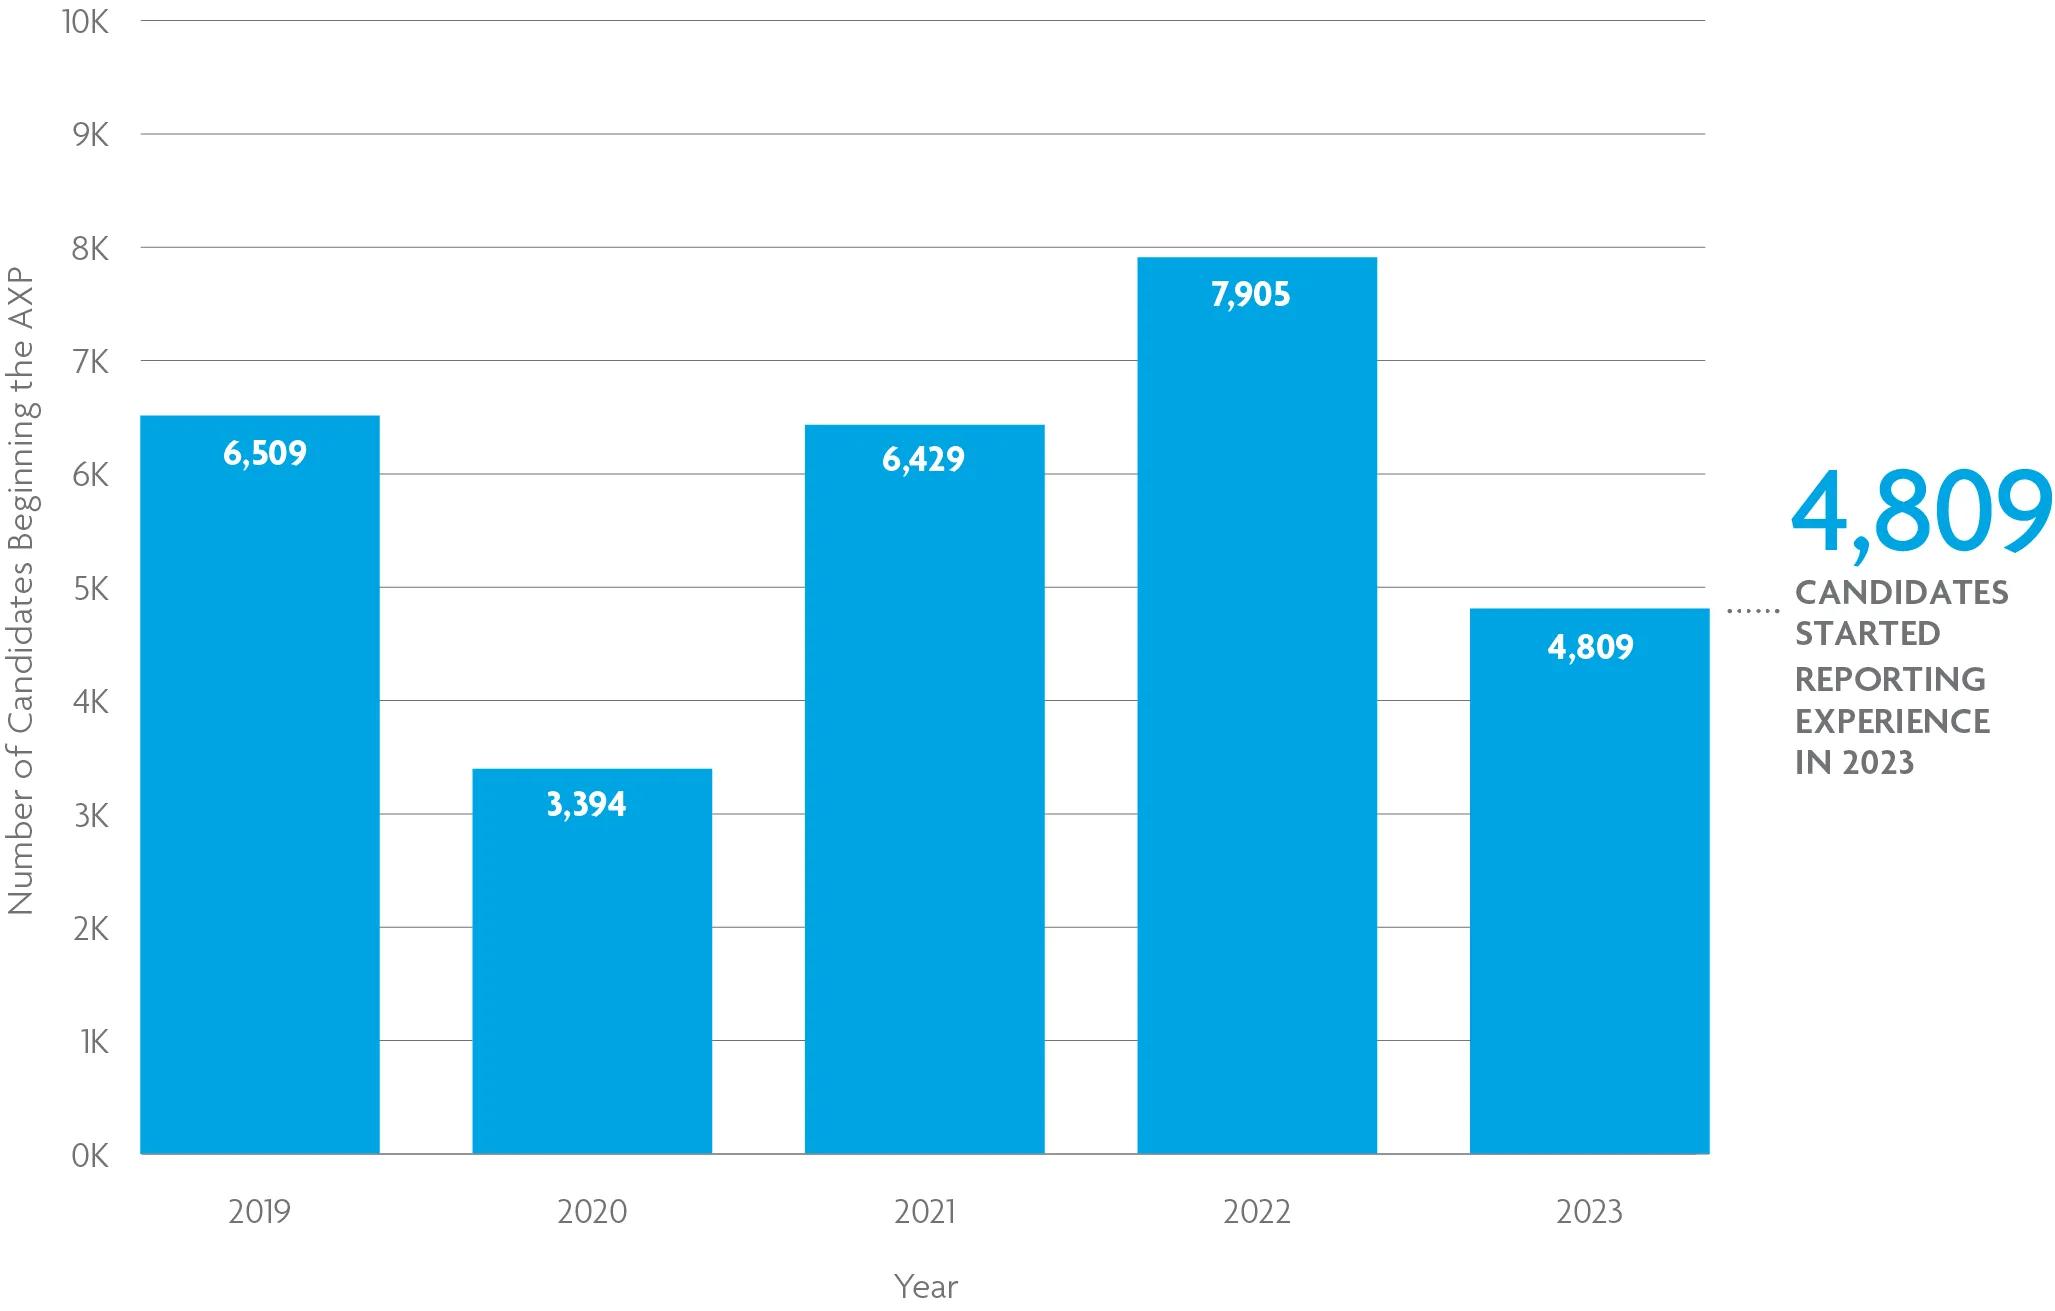
Following a drop in 2020 due to the COVID-19 pandemic, the number of candidates who begin the experience program each year is returning to normal levels.
Because candidates can report experience up to 5 years in the past, these numbers typically shift upward (sometimes dramatically) over time. When NCARB published the 2023 edition of NCARB by the Numbers, the number of candidates who had started the AXP in 2022 was 4,464. Now, just one year later, that number has risen to over 7,900 as candidates submit backdated experience. NCARB anticipates that the number reported for 2023 will also increase over the next year.
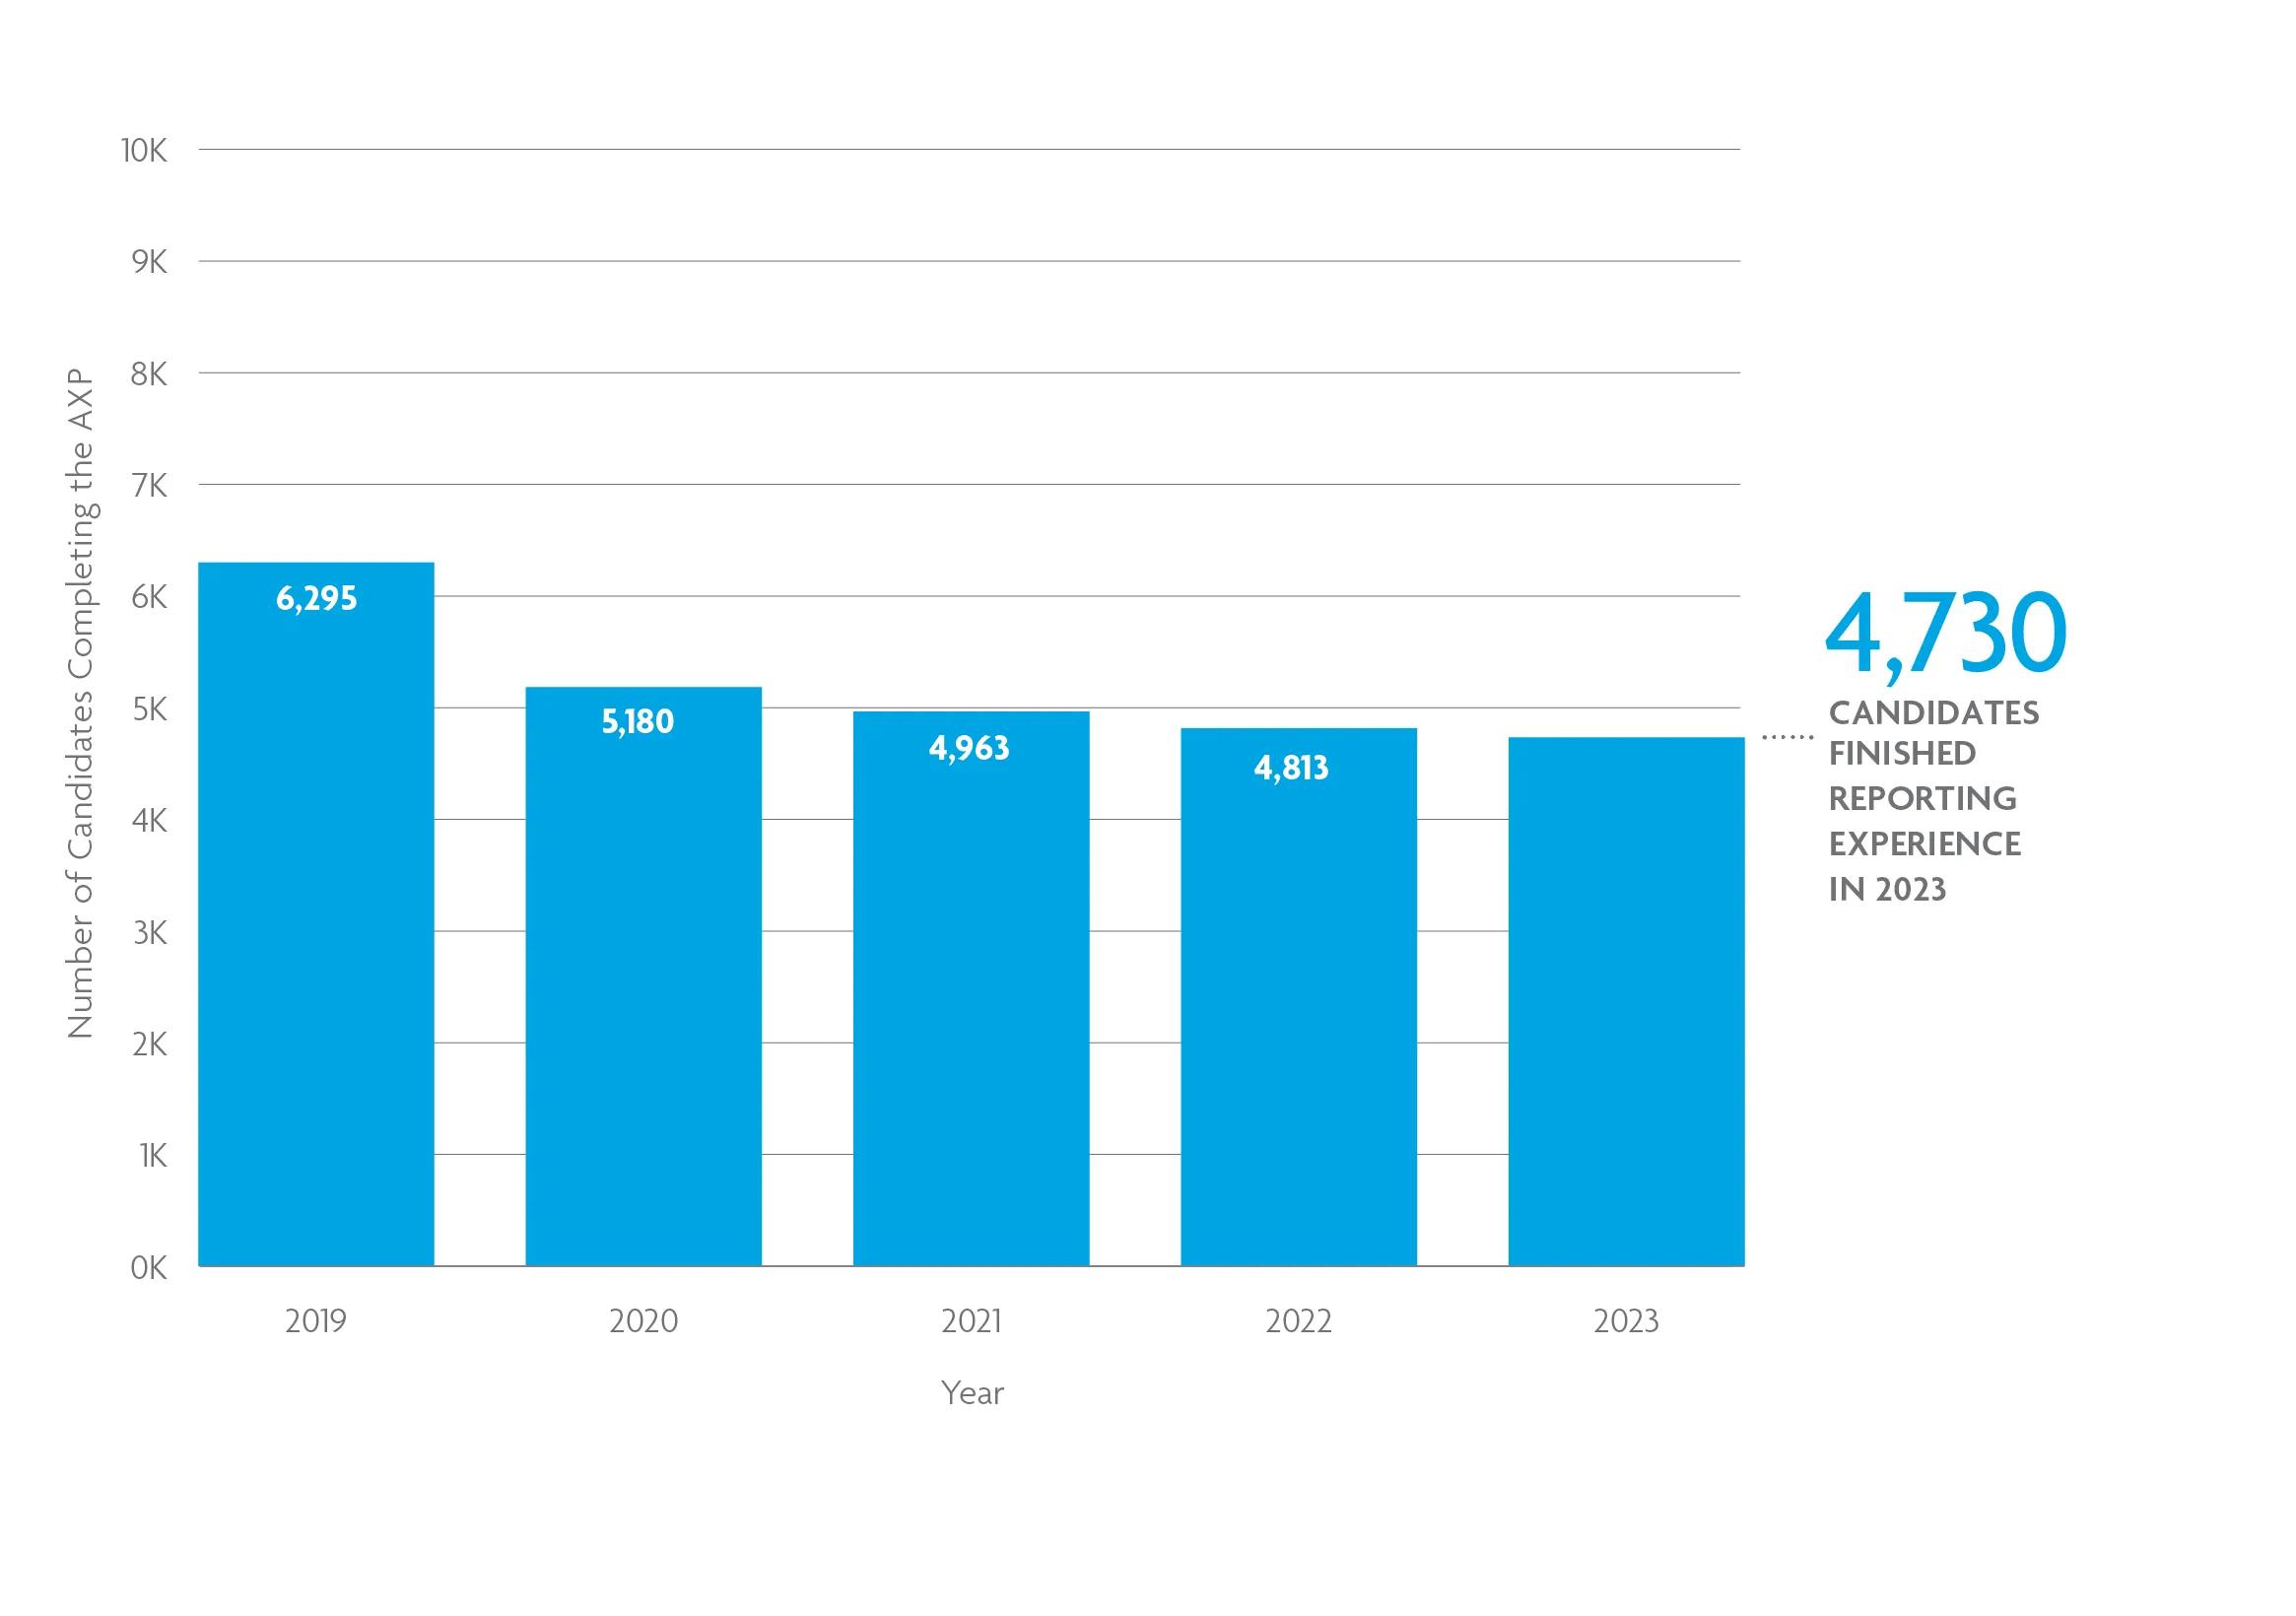
Similarly, the number of candidates who complete the AXP in a given year also shifts upward over time. Based on current data, over 4,730 candidates finished gaining the professional experience needed to complete the AXP in 2023—just 2% fewer than in 2022.
DID YOU KNOW? NCARB measures experience start and end dates based on when the work was performed. For example, if a candidate submitted their first experience report in 2025 for work performed in 2022, their AXP start date would be counted as 2022.
Most candidates reporting experience are employed by small firms.
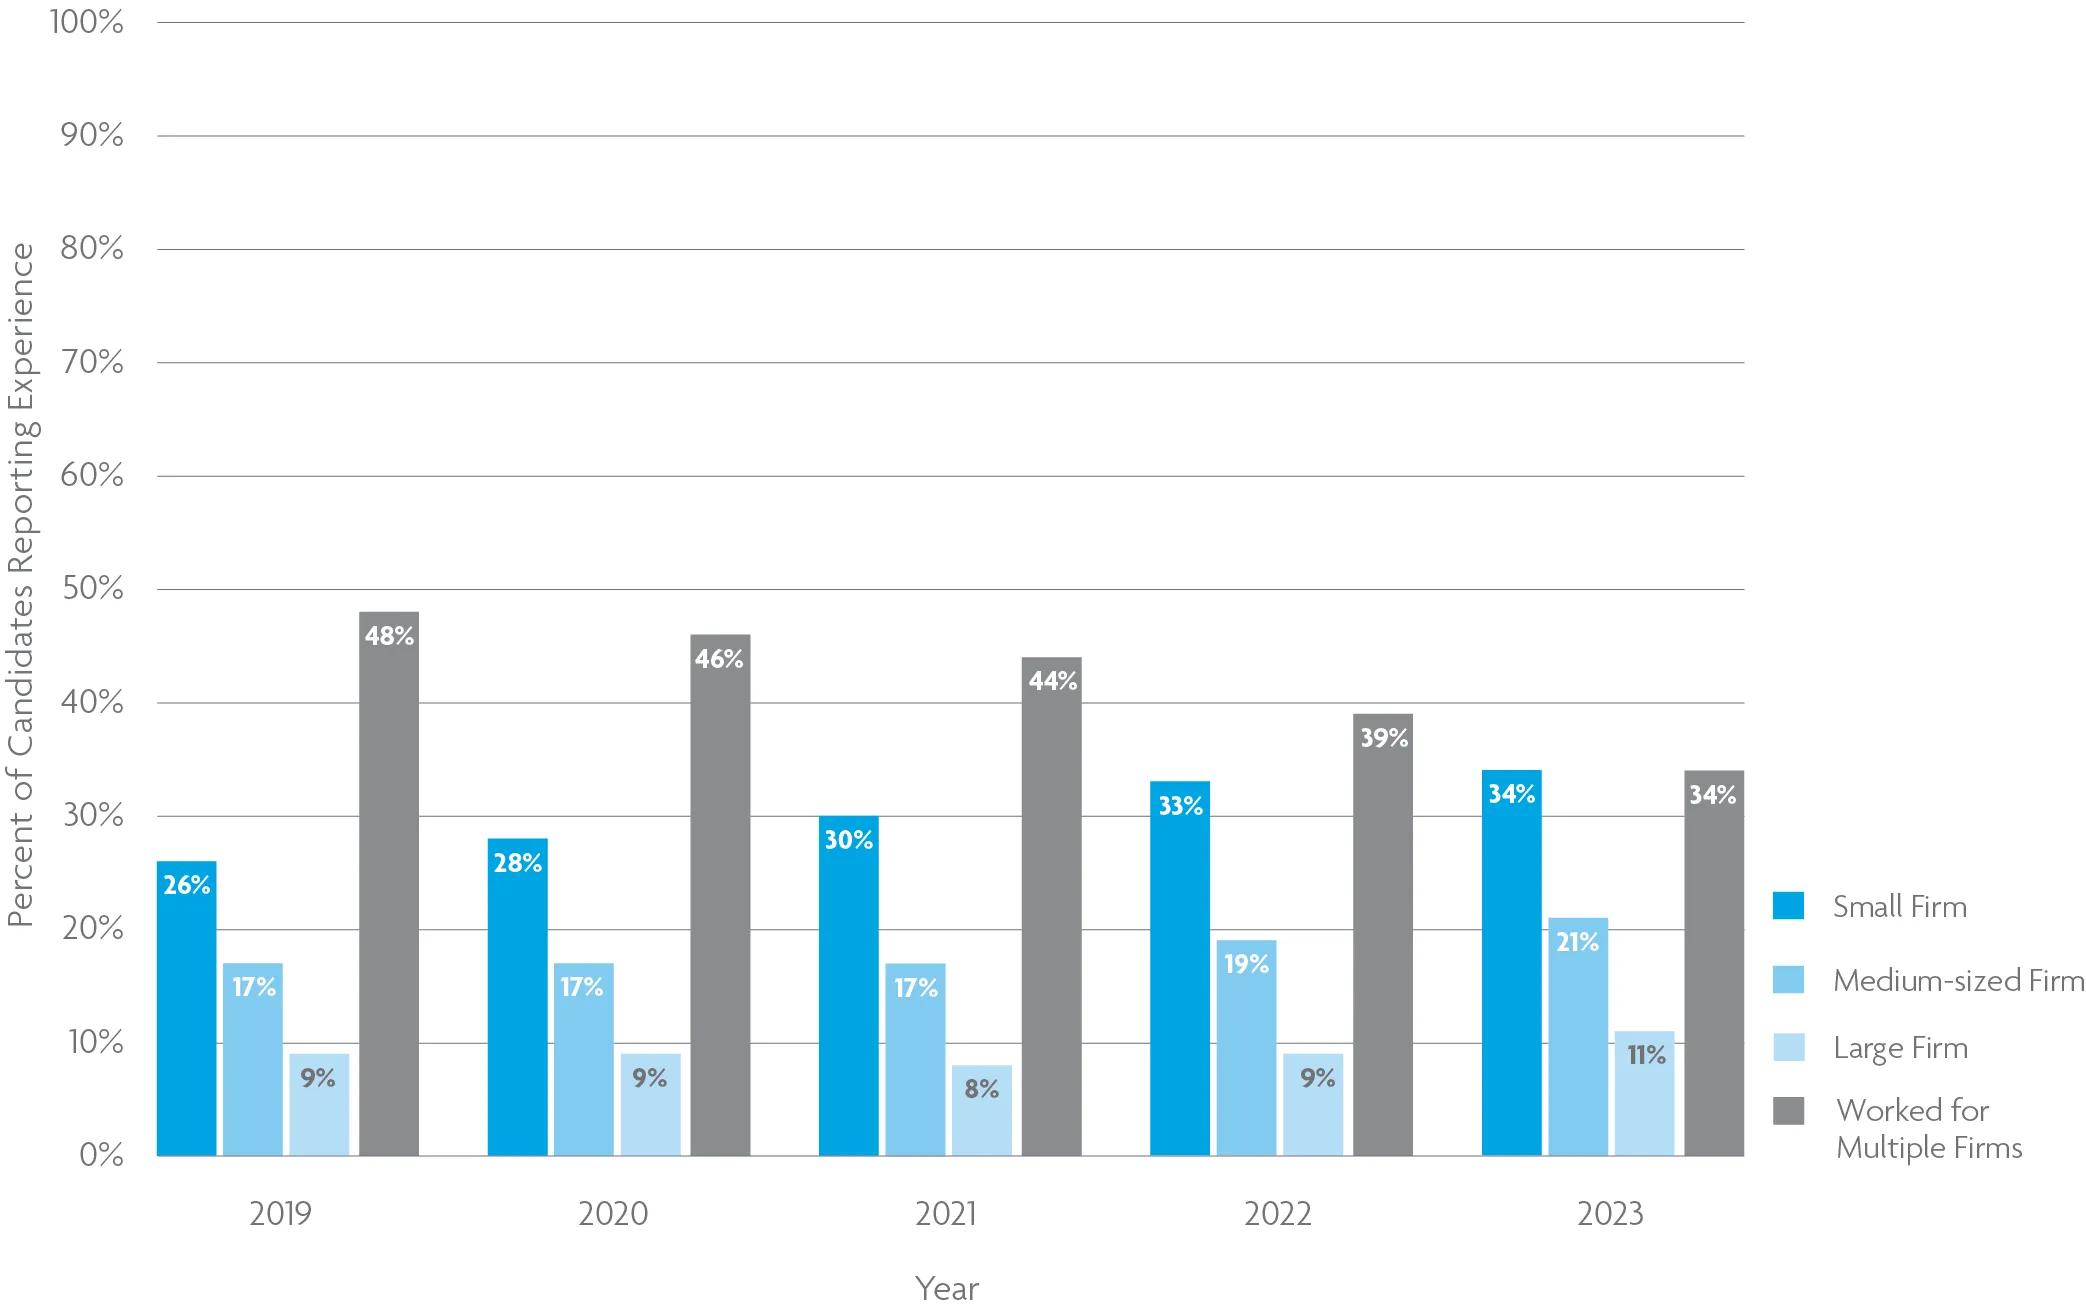
Of the 25,000 candidates reporting experience in 2023, more than a third were employed by firms with less than 10 total employees, and another 34% worked at multiple firms throughout their AXP journey. These candidates typically complete the AXP in less time than their peers at medium or large firms.
Individuals employed by large firms (more than 50 employees) make up the smallest proportion of the overall population of candidates reporting experience.
Candidates finished the AXP one month slower in 2023.
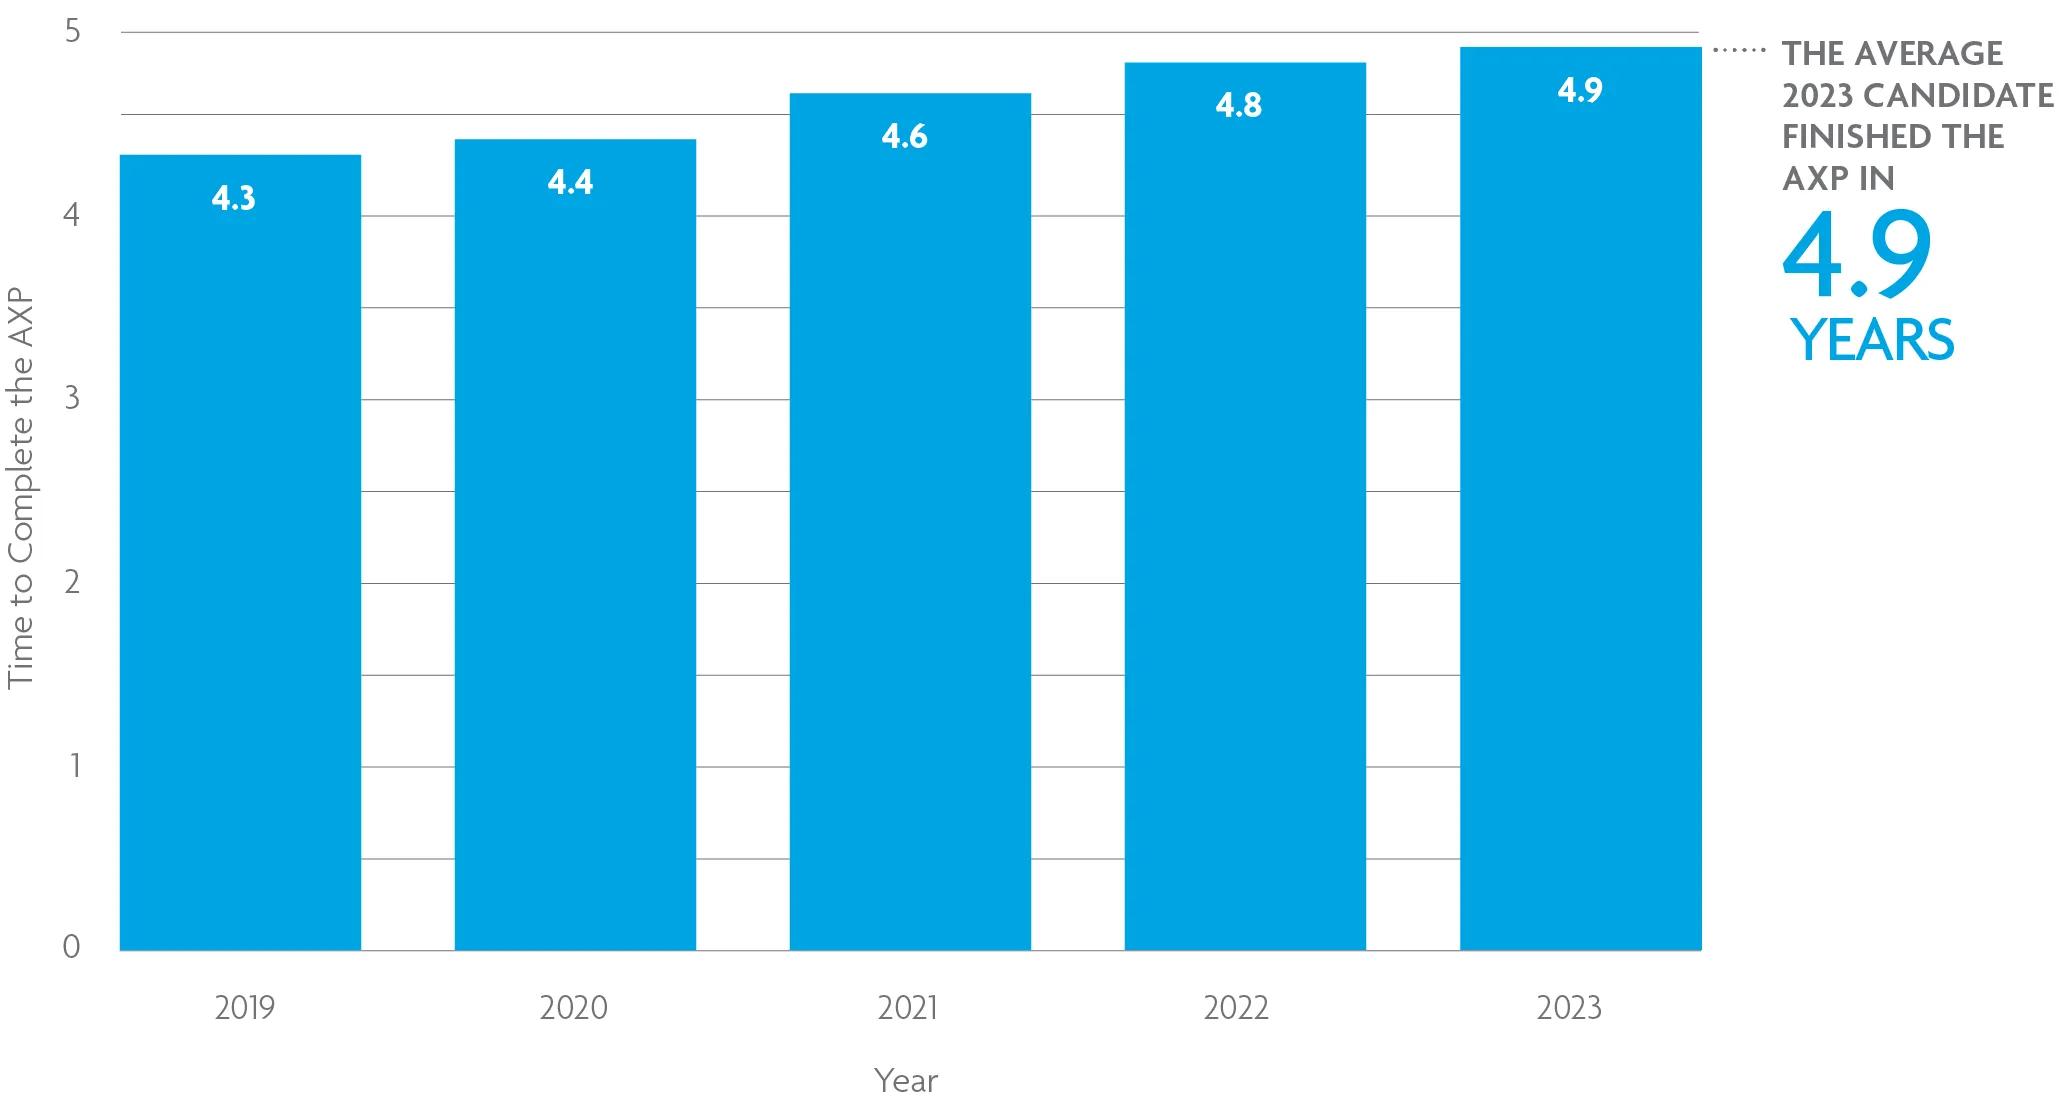
On average, candidates who completed the AXP in 2023 took 4.9 years, taking 1 month longer than candidates who completed the AXP in 2022 and 7 months longer than those who completed the AXP prior to the COVID-19 pandemic. It is likely that this 7-month extension is due to the disruption of traditional in-office mentorship and workflow caused by the pandemic.
Because the AXP typically takes between 4 and 5 years to complete, NCARB will continue seeing the impact of the COVID-19 pandemic on candidates navigating the AXP until at least 2025. Many candidates who completed the program in 2023 would have started earning and reporting professional experience in 2019, and are likely to have had their career trajectories altered by the pandemic.
DID YOU KNOW? Averages can be measured in several ways. NCARB uses median to measure averages throughout NCARB by the Numbers, which allows us to avoid skewing the average with outlier data points.
Nearly a third of candidates complete the AXP in less than 4 years.
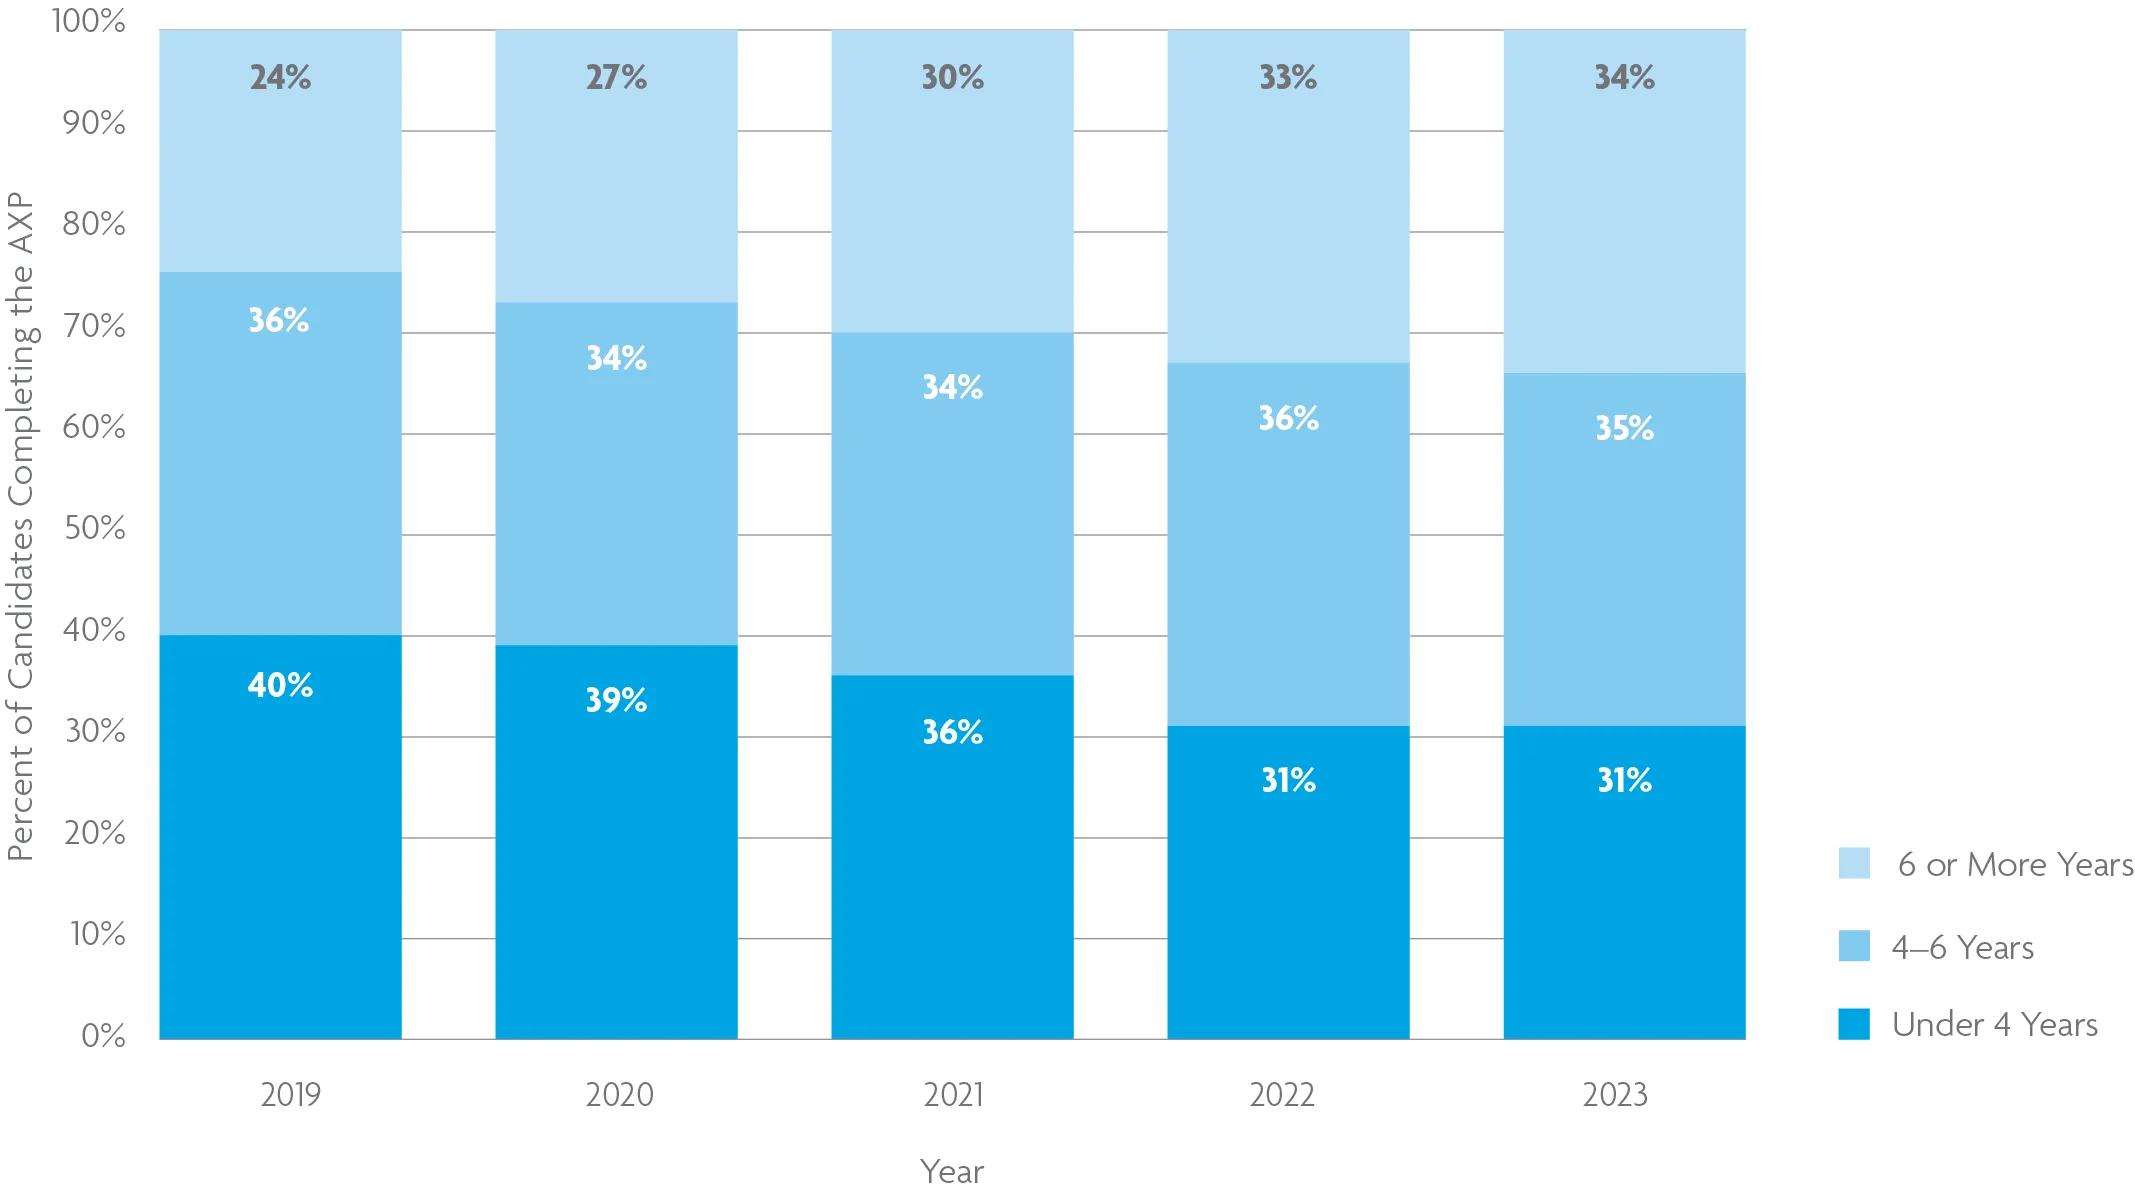
Time to complete the experience program breaks down relatively evenly: roughly a third of candidates finish the experience program in less than 4 years, and roughly a third of candidates take more than 6 years.
Prior to the COVID-19 pandemic, more candidates finished the program in a shorter time frame. Because candidates have historically taken 4-5 years to complete the program, it may be several more years before NCARB sees AXP completion times return to pre-pandemic levels.
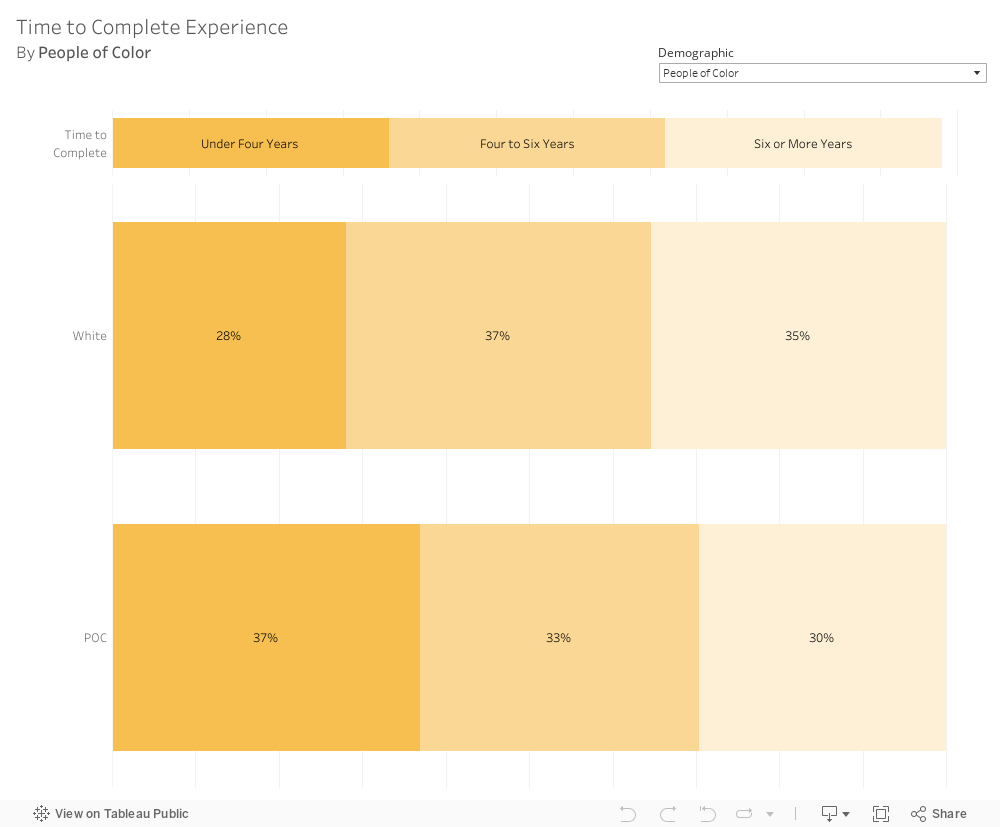
Typically, women and people of color are more likely to complete the AXP in a shorter time frame compared to their peers. This is often because men and white candidates tend to begin reporting experience younger (often while in school), but then have a period of slow progress because they aren’t working full-time.
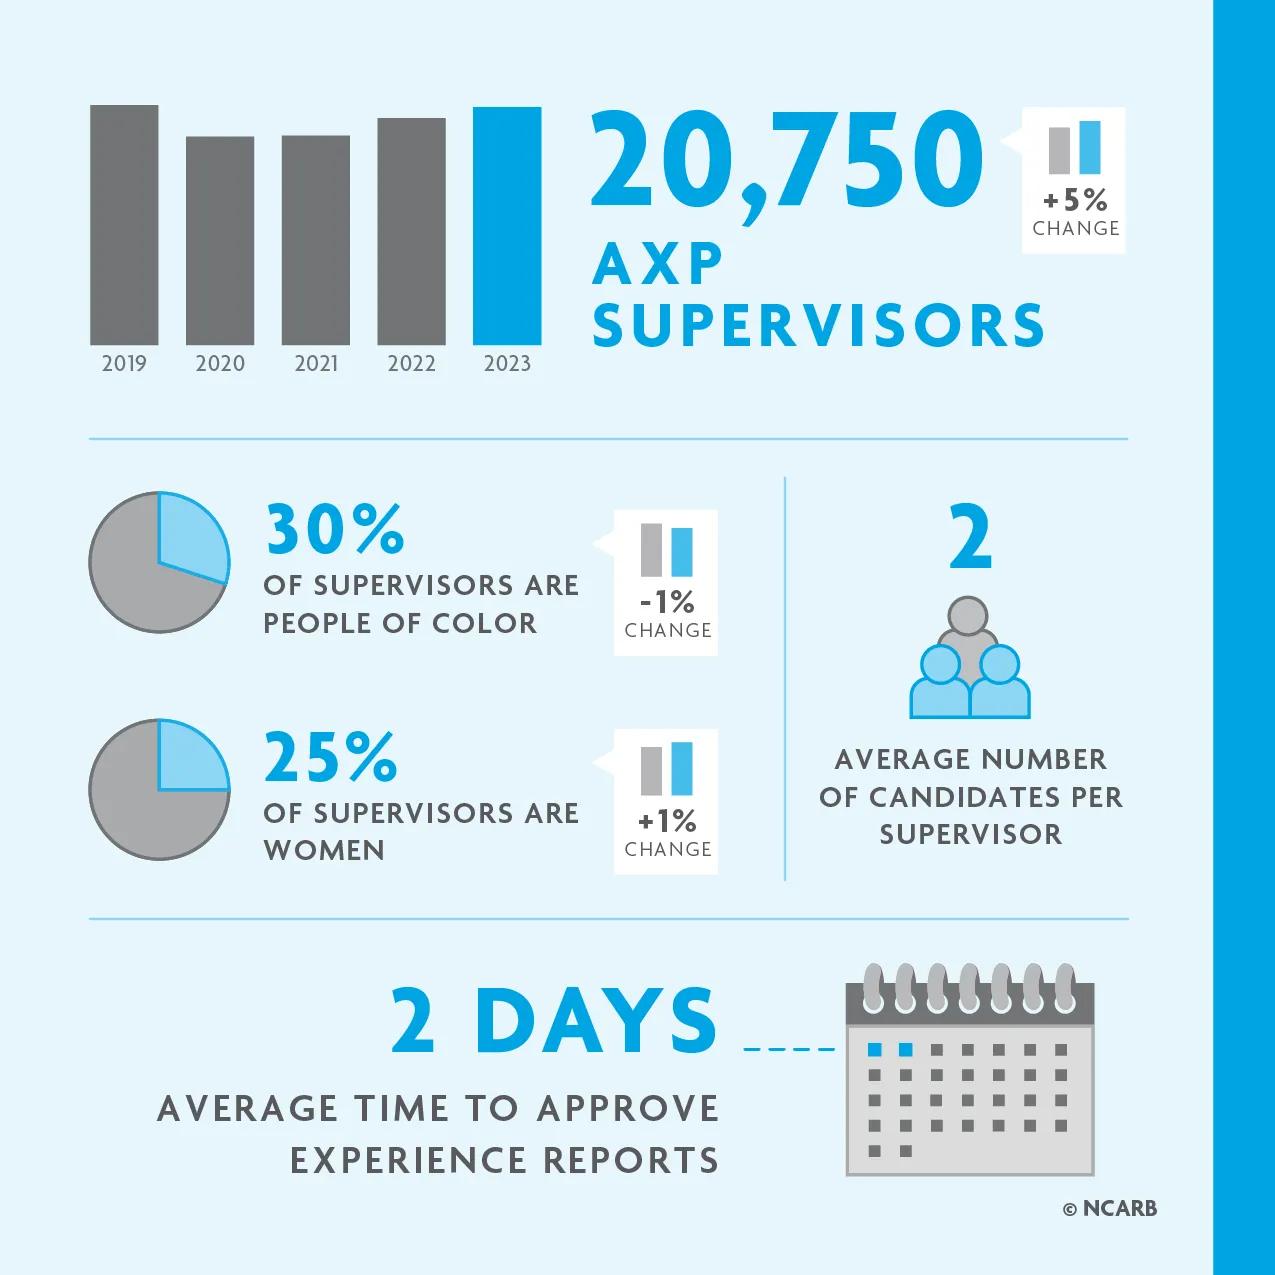
Gender diversity in supervisors is improving.
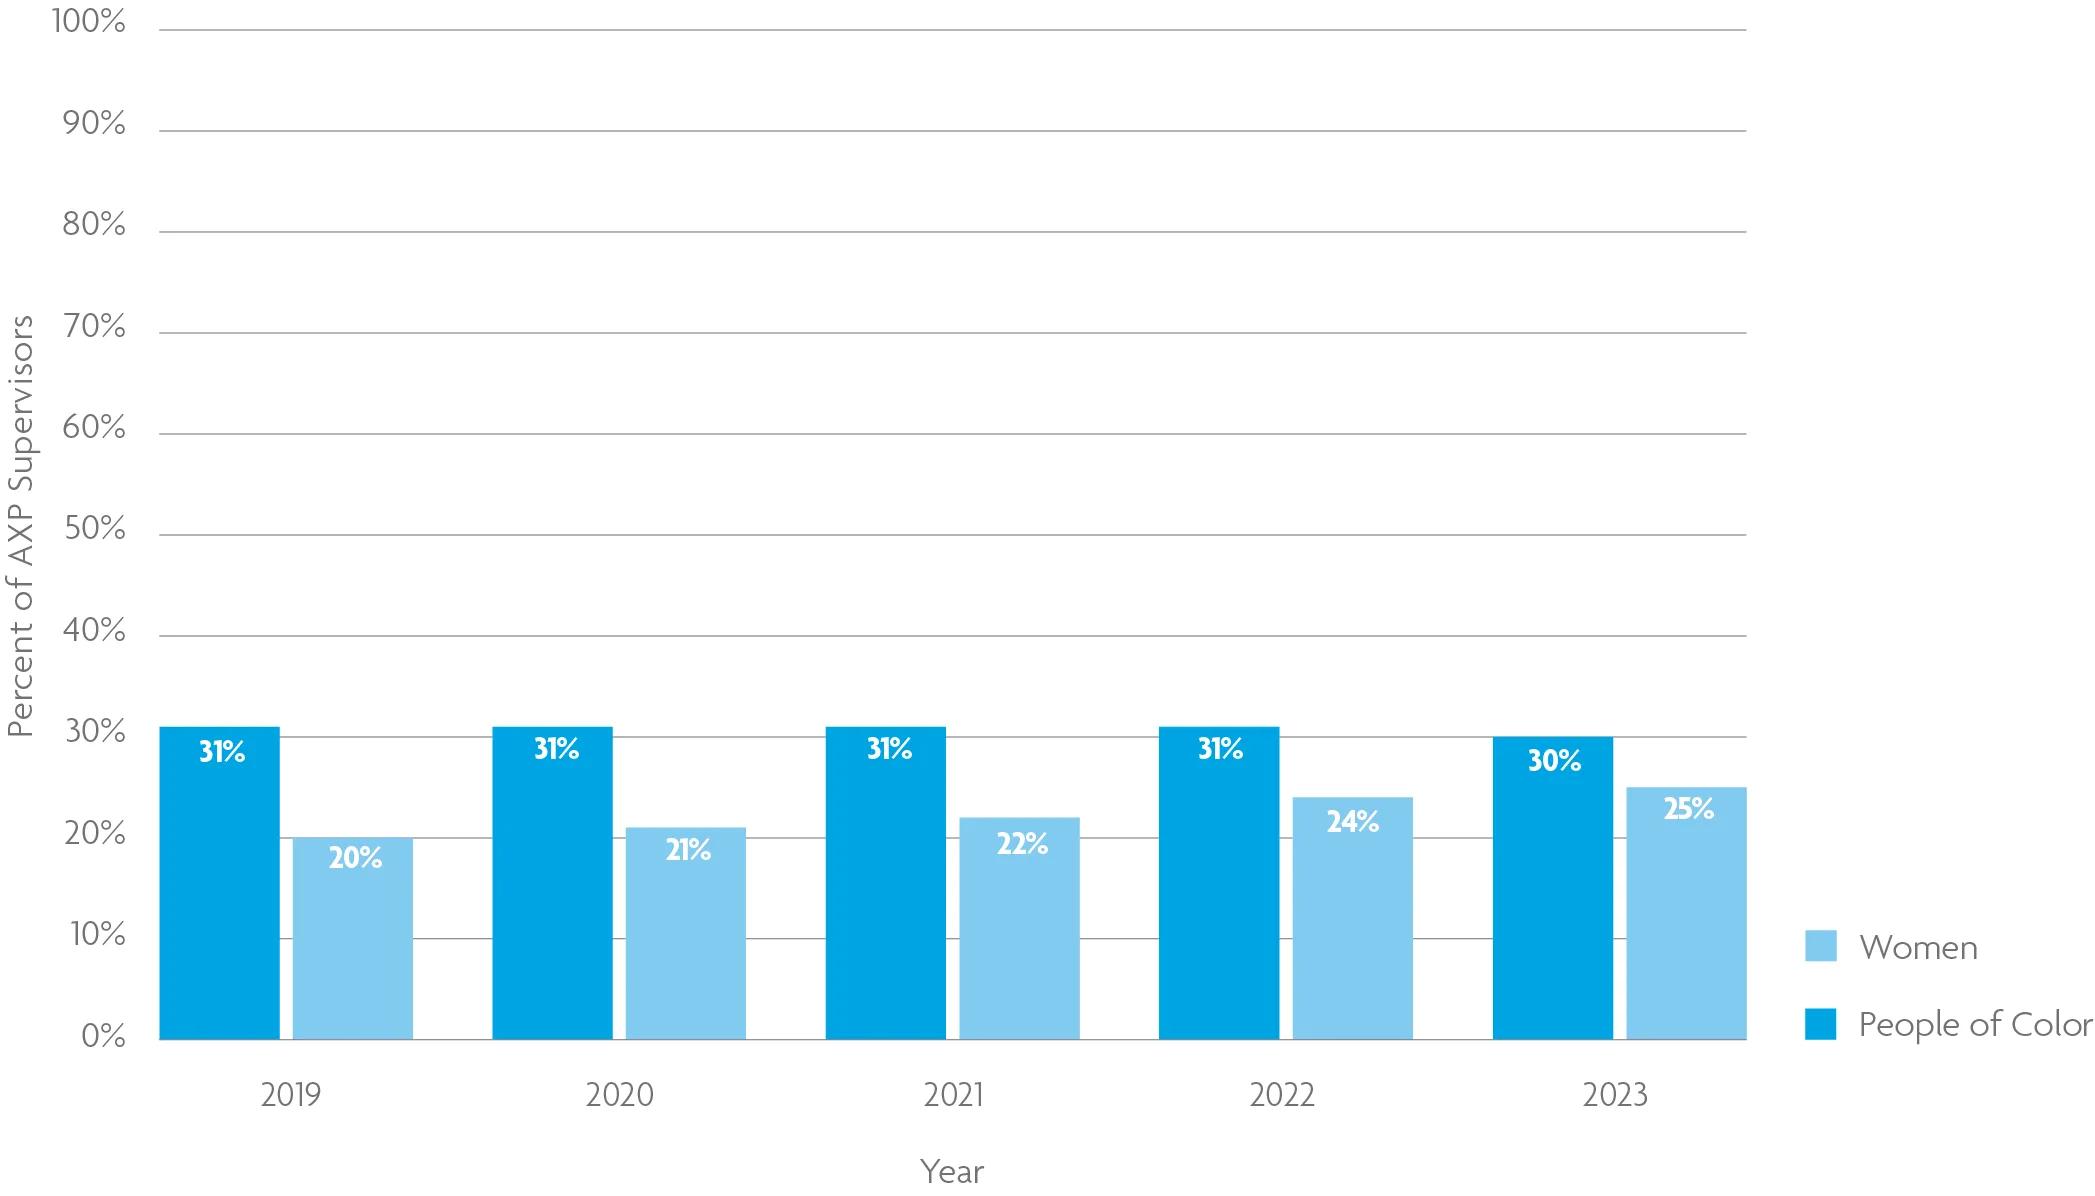
Women are better represented in the pool of AXP supervisors than they were 5 years ago: in 2023, 25% of AXP supervisors were women. By contrast, the racial and ethnic diversity of AXP supervisors has remained relatively unchanged over the past 5 years, with people of color making up just 30% of the supervisor pool in 2023.
For comparison, approximately 27% of U.S. architects are women, and 19% are people of color—indicating that the population of AXP supervisors is more diverse than the overall practitioner population.