
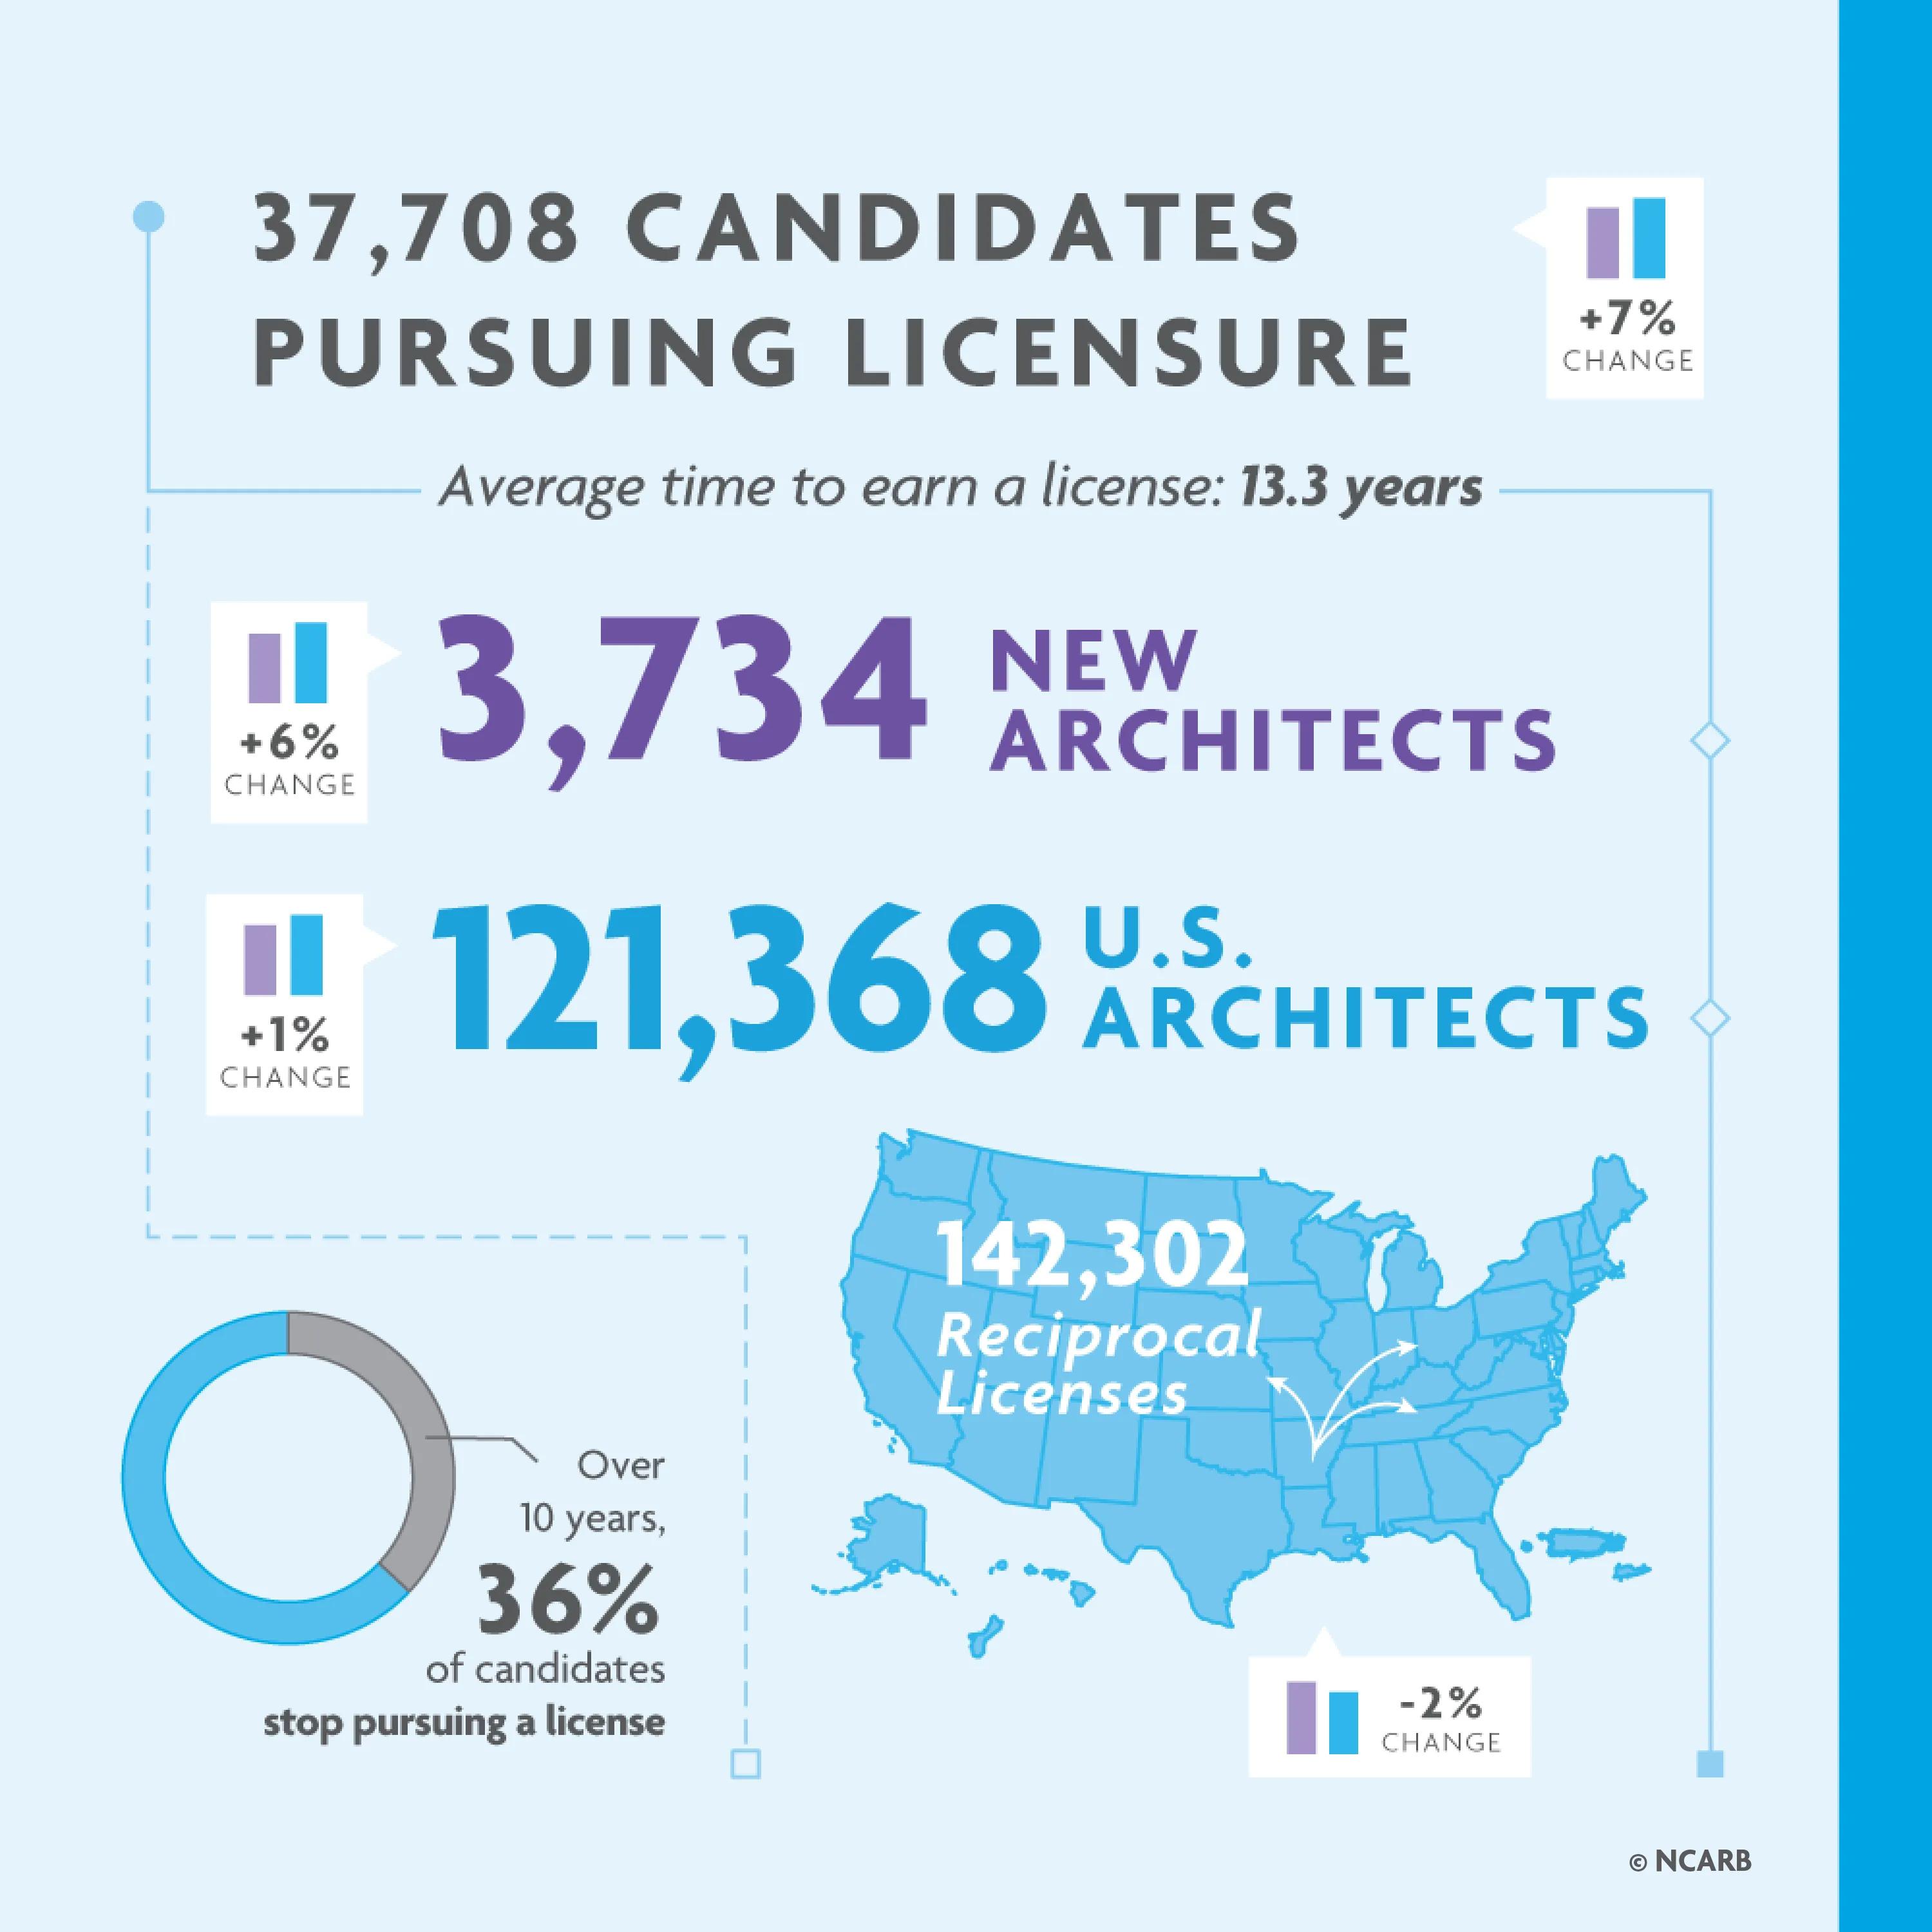
Overall, licensure progress was on the rise in 2023. While the total number of U.S. architects saw a 1% increase to 121,000 following last year’s decline, the pipeline of individuals pursuing licensure saw several significant gains compared to 2022.
The number of individuals actively working to become architects rose by 7% to 37,000. Similarly, the number of newly licensed architects rose by 6% in 2023 to over 3,700. On average, it takes candidates 13.3 years to earn a license—slightly longer than the average pre-pandemic time to licensure.
Recently, NCARB has implemented several programmatic changes that could impact the state of licensure. These include the retirement of the licensing exam’s five-year expiration date on passed divisions, the reinstatement of thousands of previously expired exam divisions, and the launch of free practice exams, which have contributed to higher pass rates.
Typically, around 37% of candidates stop pursuing licensure over a 10-year period. As NCARB reduces unnecessary impediments and improves accessibility on the path to licensure, we hope to see these changes reflected in attrition rates and licensure statistics in the years to come.
The number of U.S. architects increased by 1%.
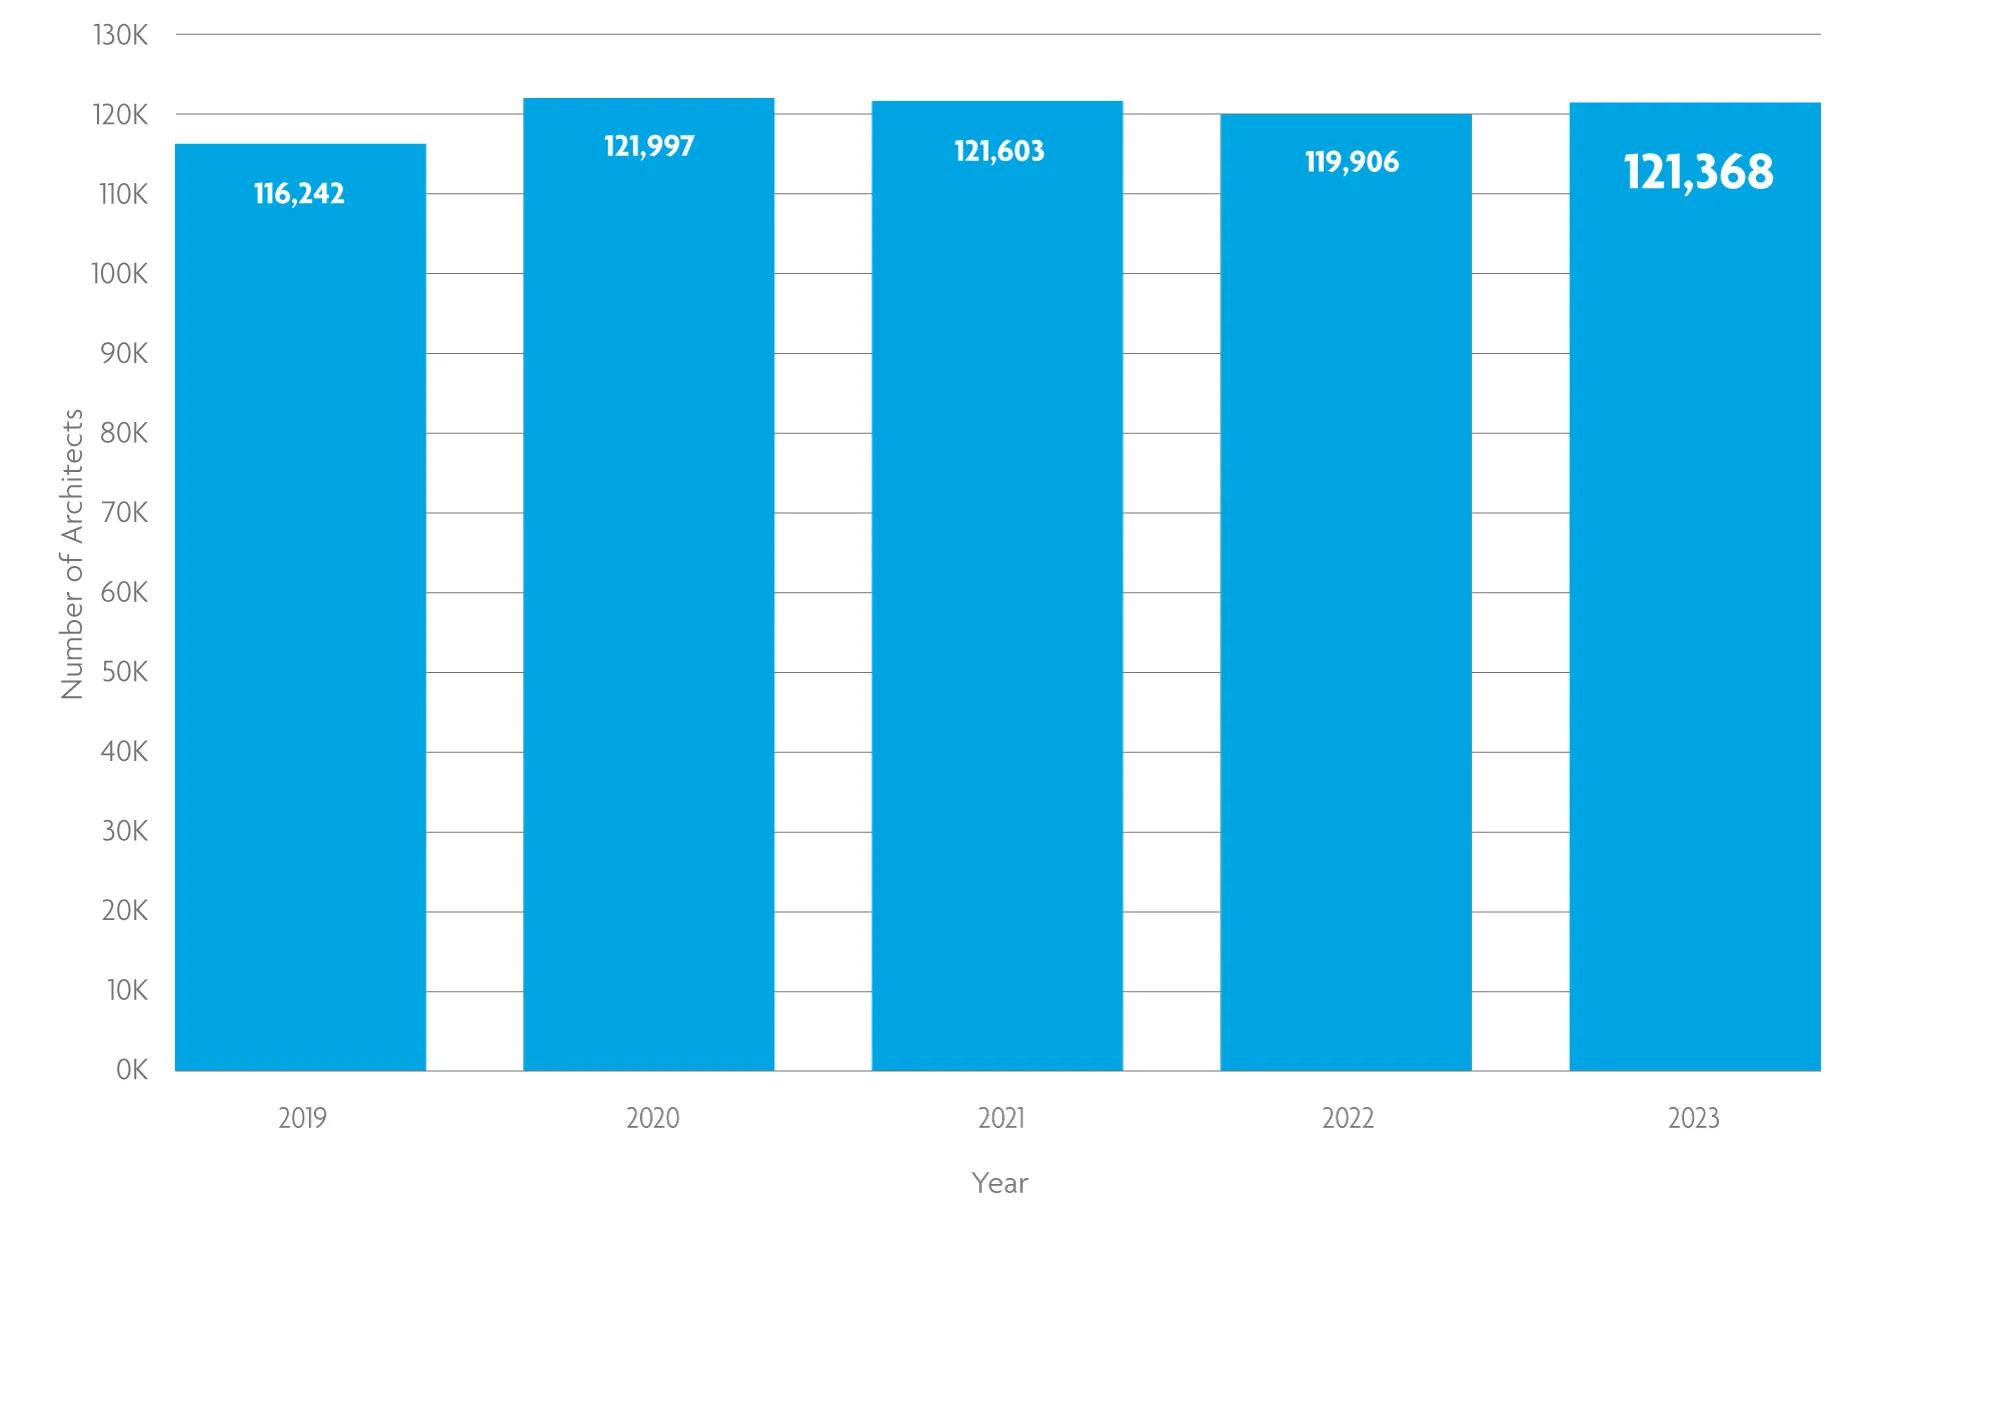
The number of U.S. architects rose by 1% in 2023, according to NCARB’s annual Survey of Architectural Registration Boards. The total number of architects licensed in the U.S. has held close to 120,000 since 2020, when the COVID-19 pandemic curbed the steady upward trend seen in previous years.
This year’s growth indicates that there are more individuals becoming architects than there are retiring from the profession. However, a third of architects are baby boomers, and 13% are over the age of retirement. Because of this, NCARB anticipates a decrease in the number of practitioners in the coming years as increasing numbers of baby boomers retire.

The number of active licensure candidates increased by 7%.
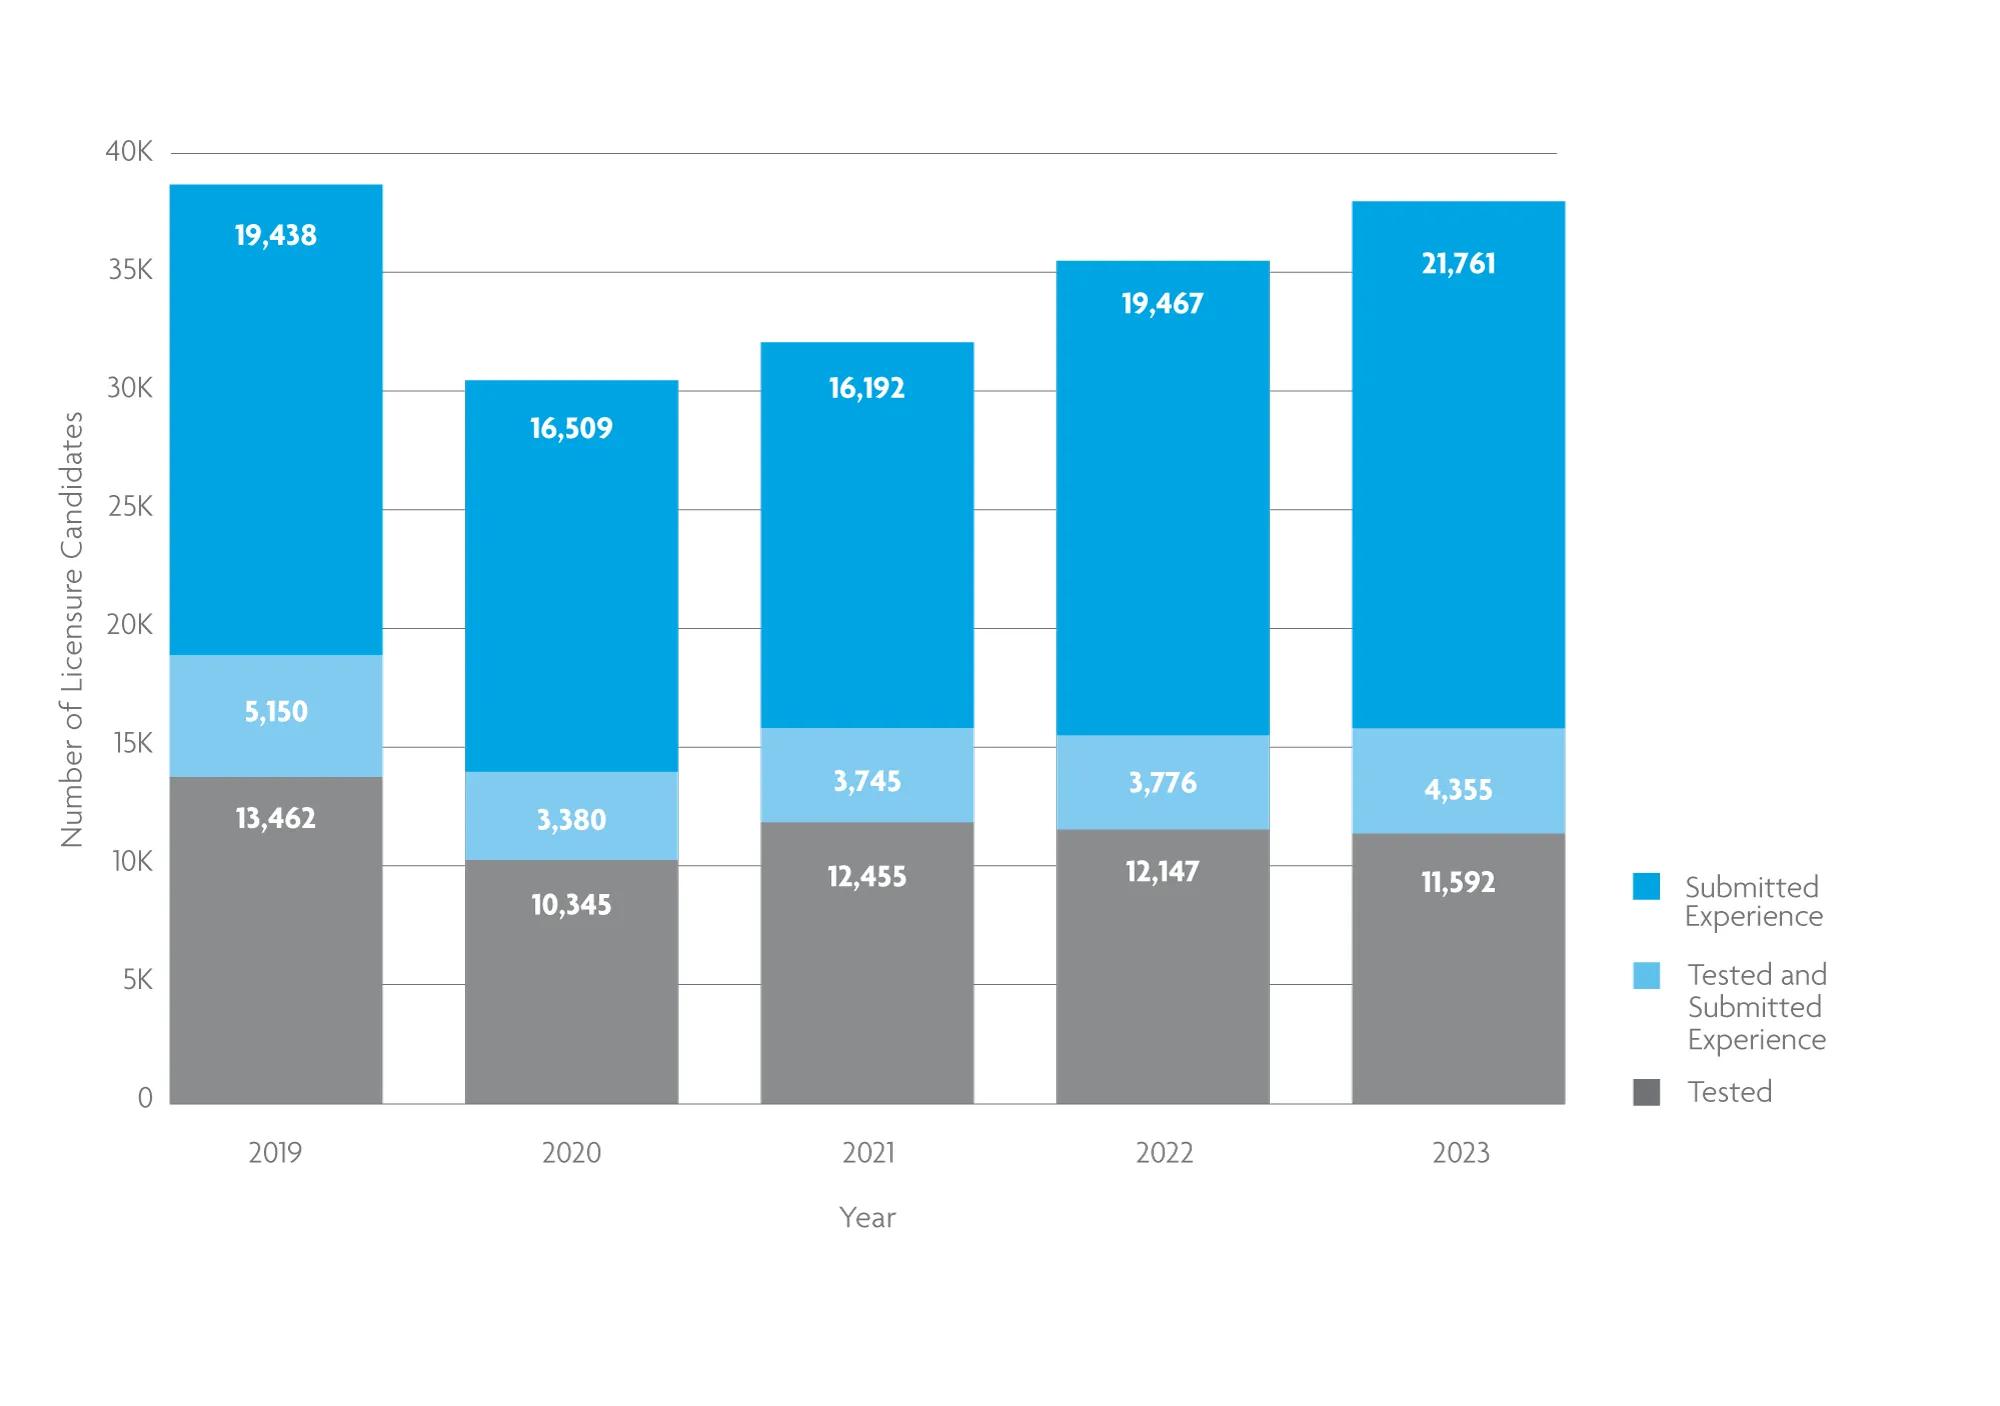
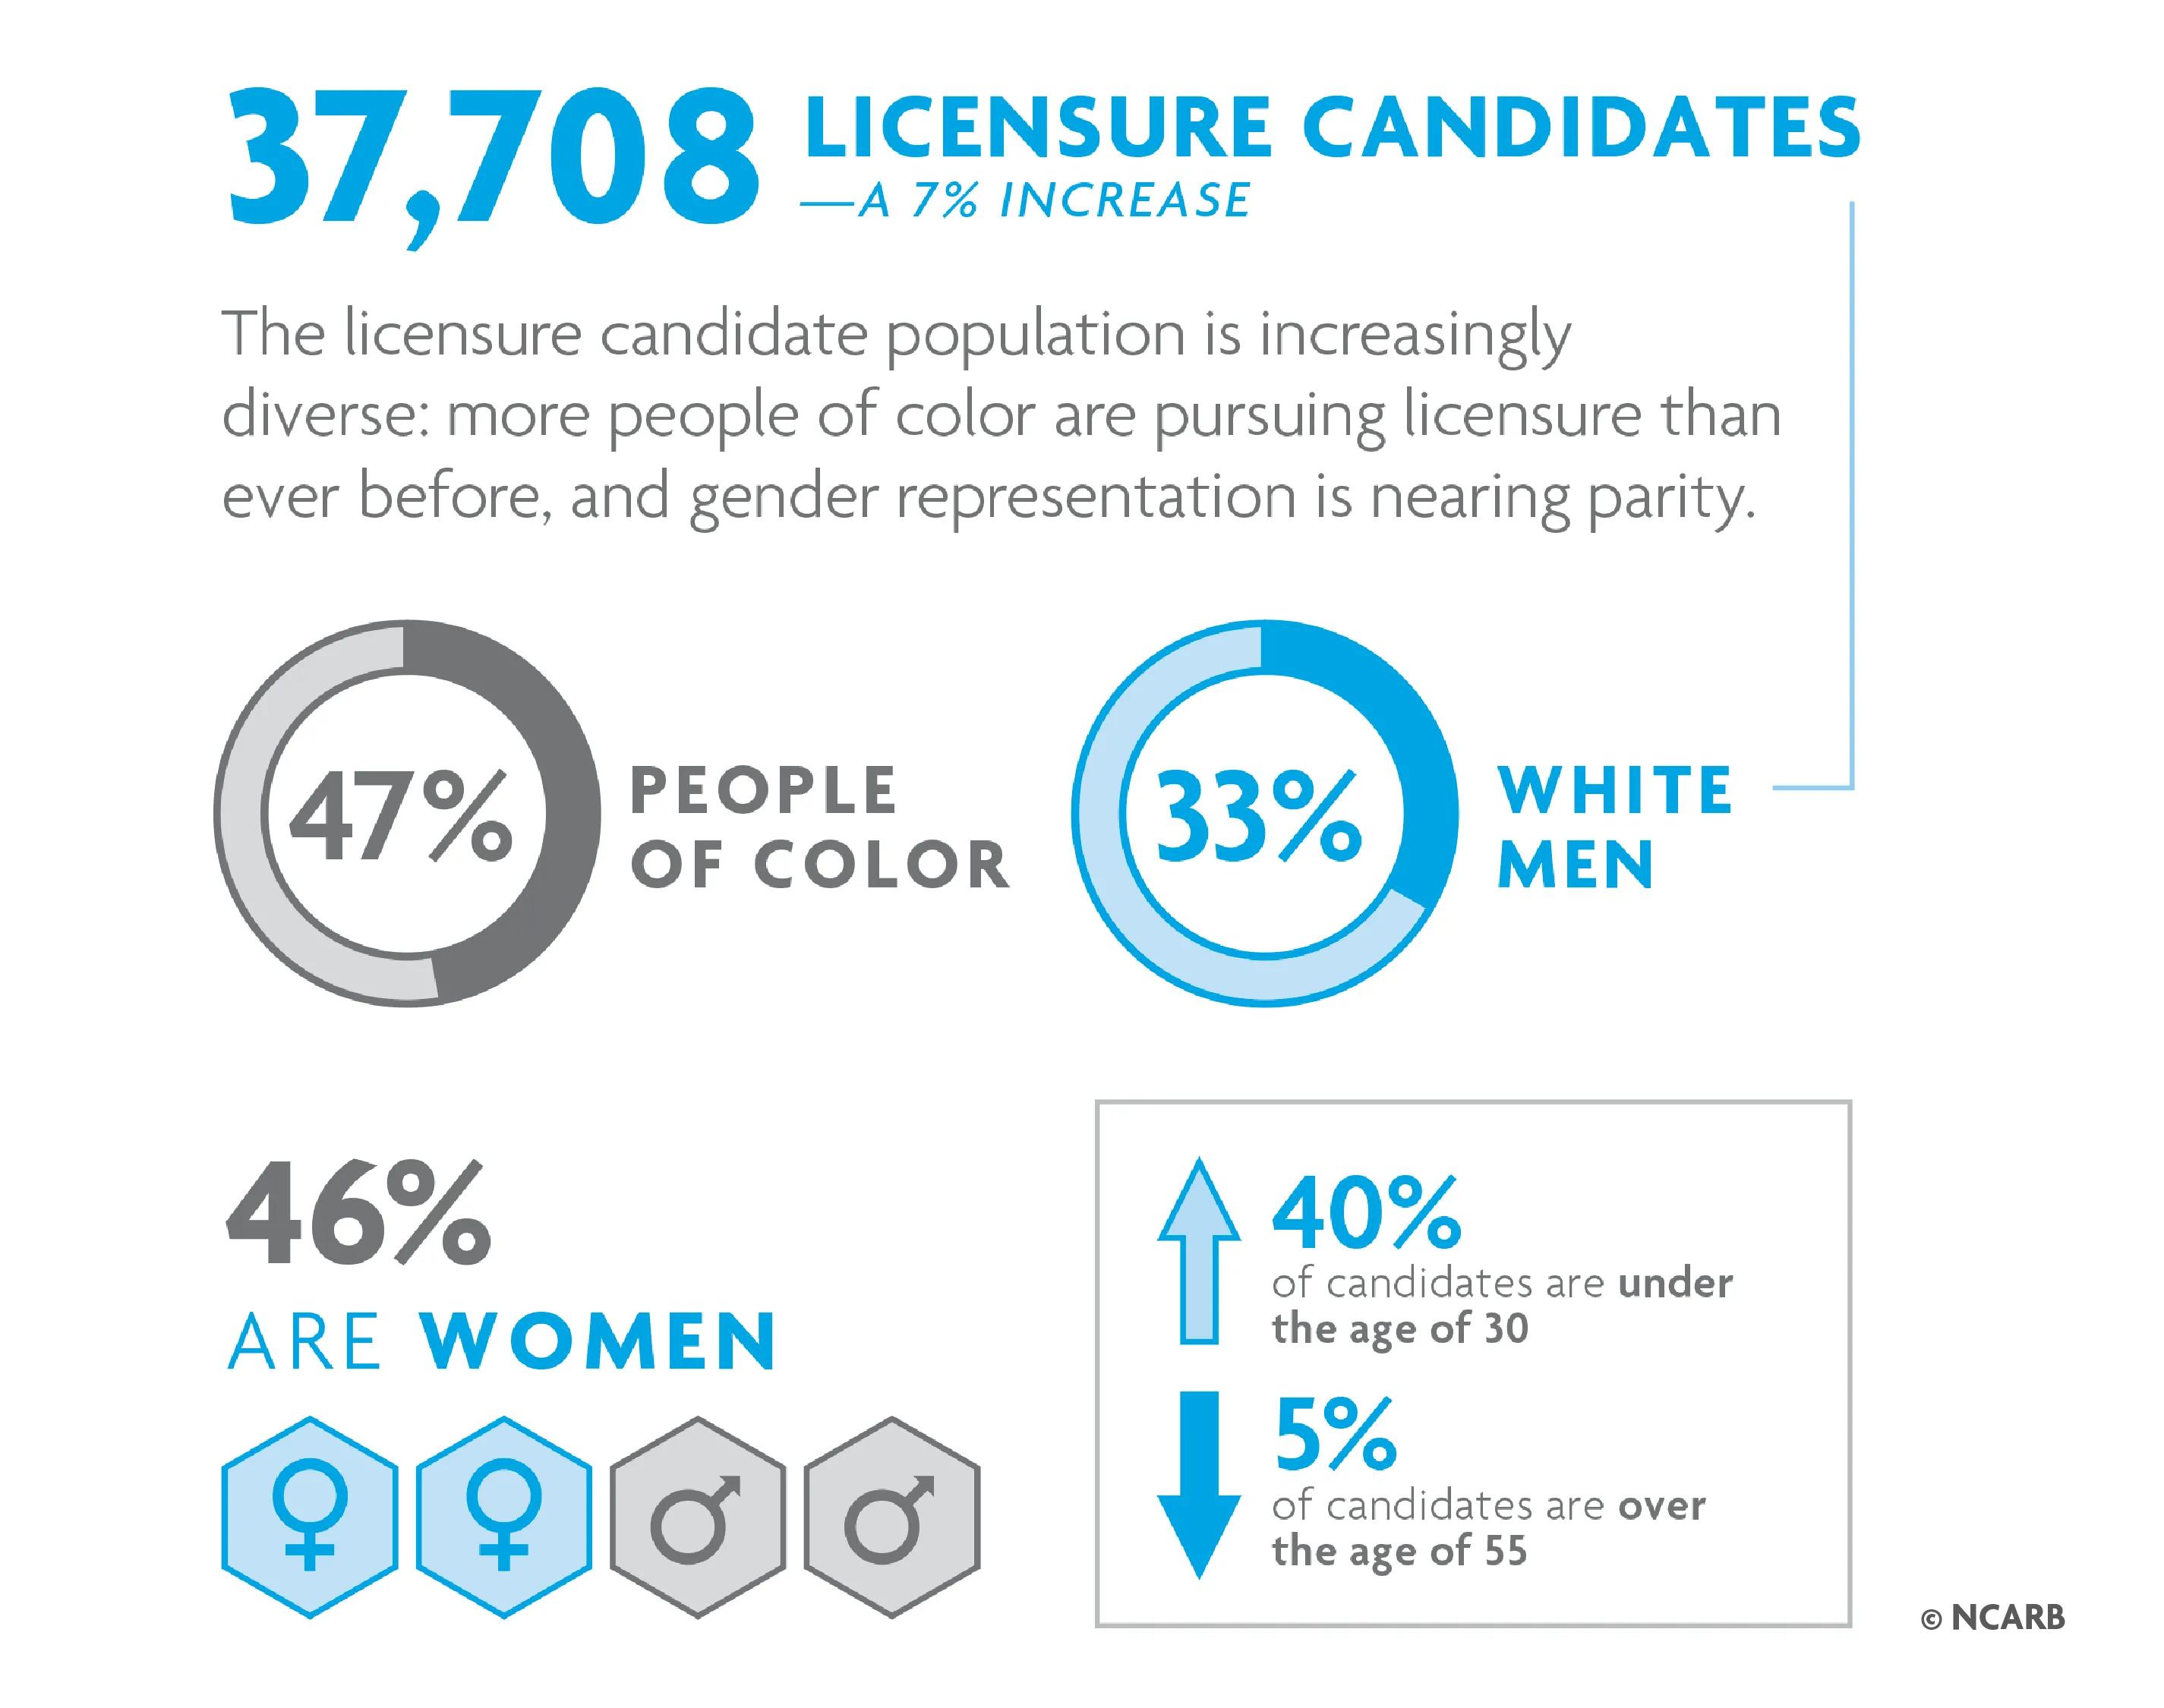
The number of candidates actively pursuing licensure rose significantly in 2023. With 37,708 candidates reporting experience, taking the exam, or both, this number is now just below pre-pandemic numbers.
Over 26,000 of these candidates reported experience in 2023—a positive sign that the licensure pipeline is recovering from the impact of the COVID-19 pandemic. While the number of candidates testing remained relatively stable throughout the pandemic and the years following, the number of candidates reporting experience has been slower to recover. This year’s increase indicates that the pipeline of new architects is healthy and growing.
The number of new architects rose by 6%.
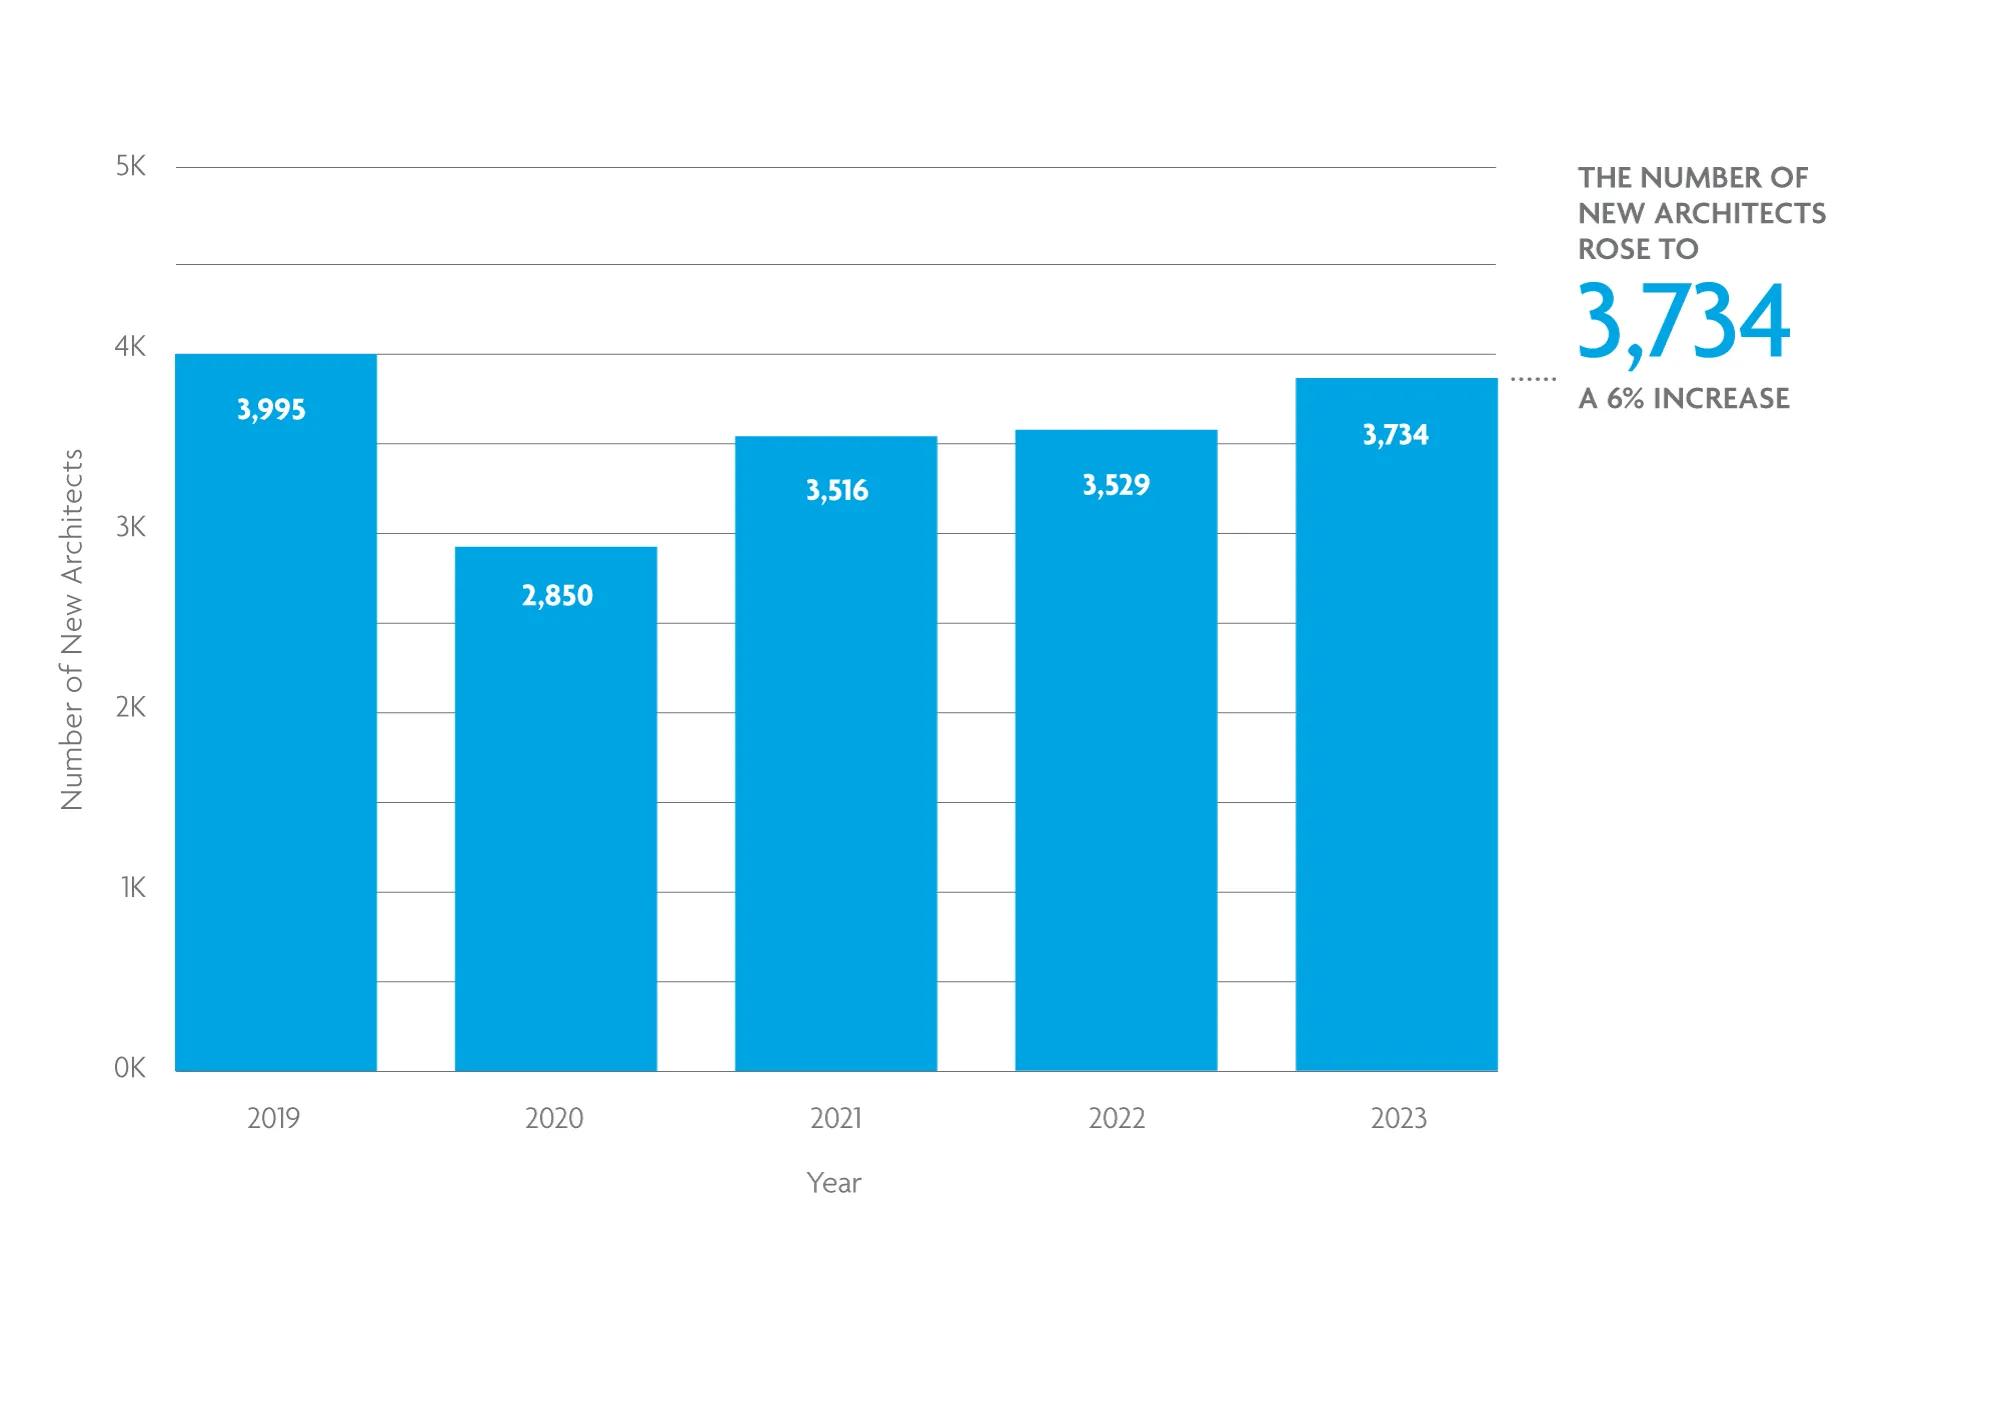
Just over 3,700 licensure candidates finished the path to licensure and became architects in 2023, taking an average of 13.3 years to do so. This 6% increase in the number of new architects correlates with the increase in the total pool of individuals pursuing licensure.
Who's considered a "new architect"?
“New architects” refers to individuals who completed their final requirement for licensure in a given year. The last requirement for most candidates is the exam, which is why the number of new architects closely aligns with the number of exam completions.
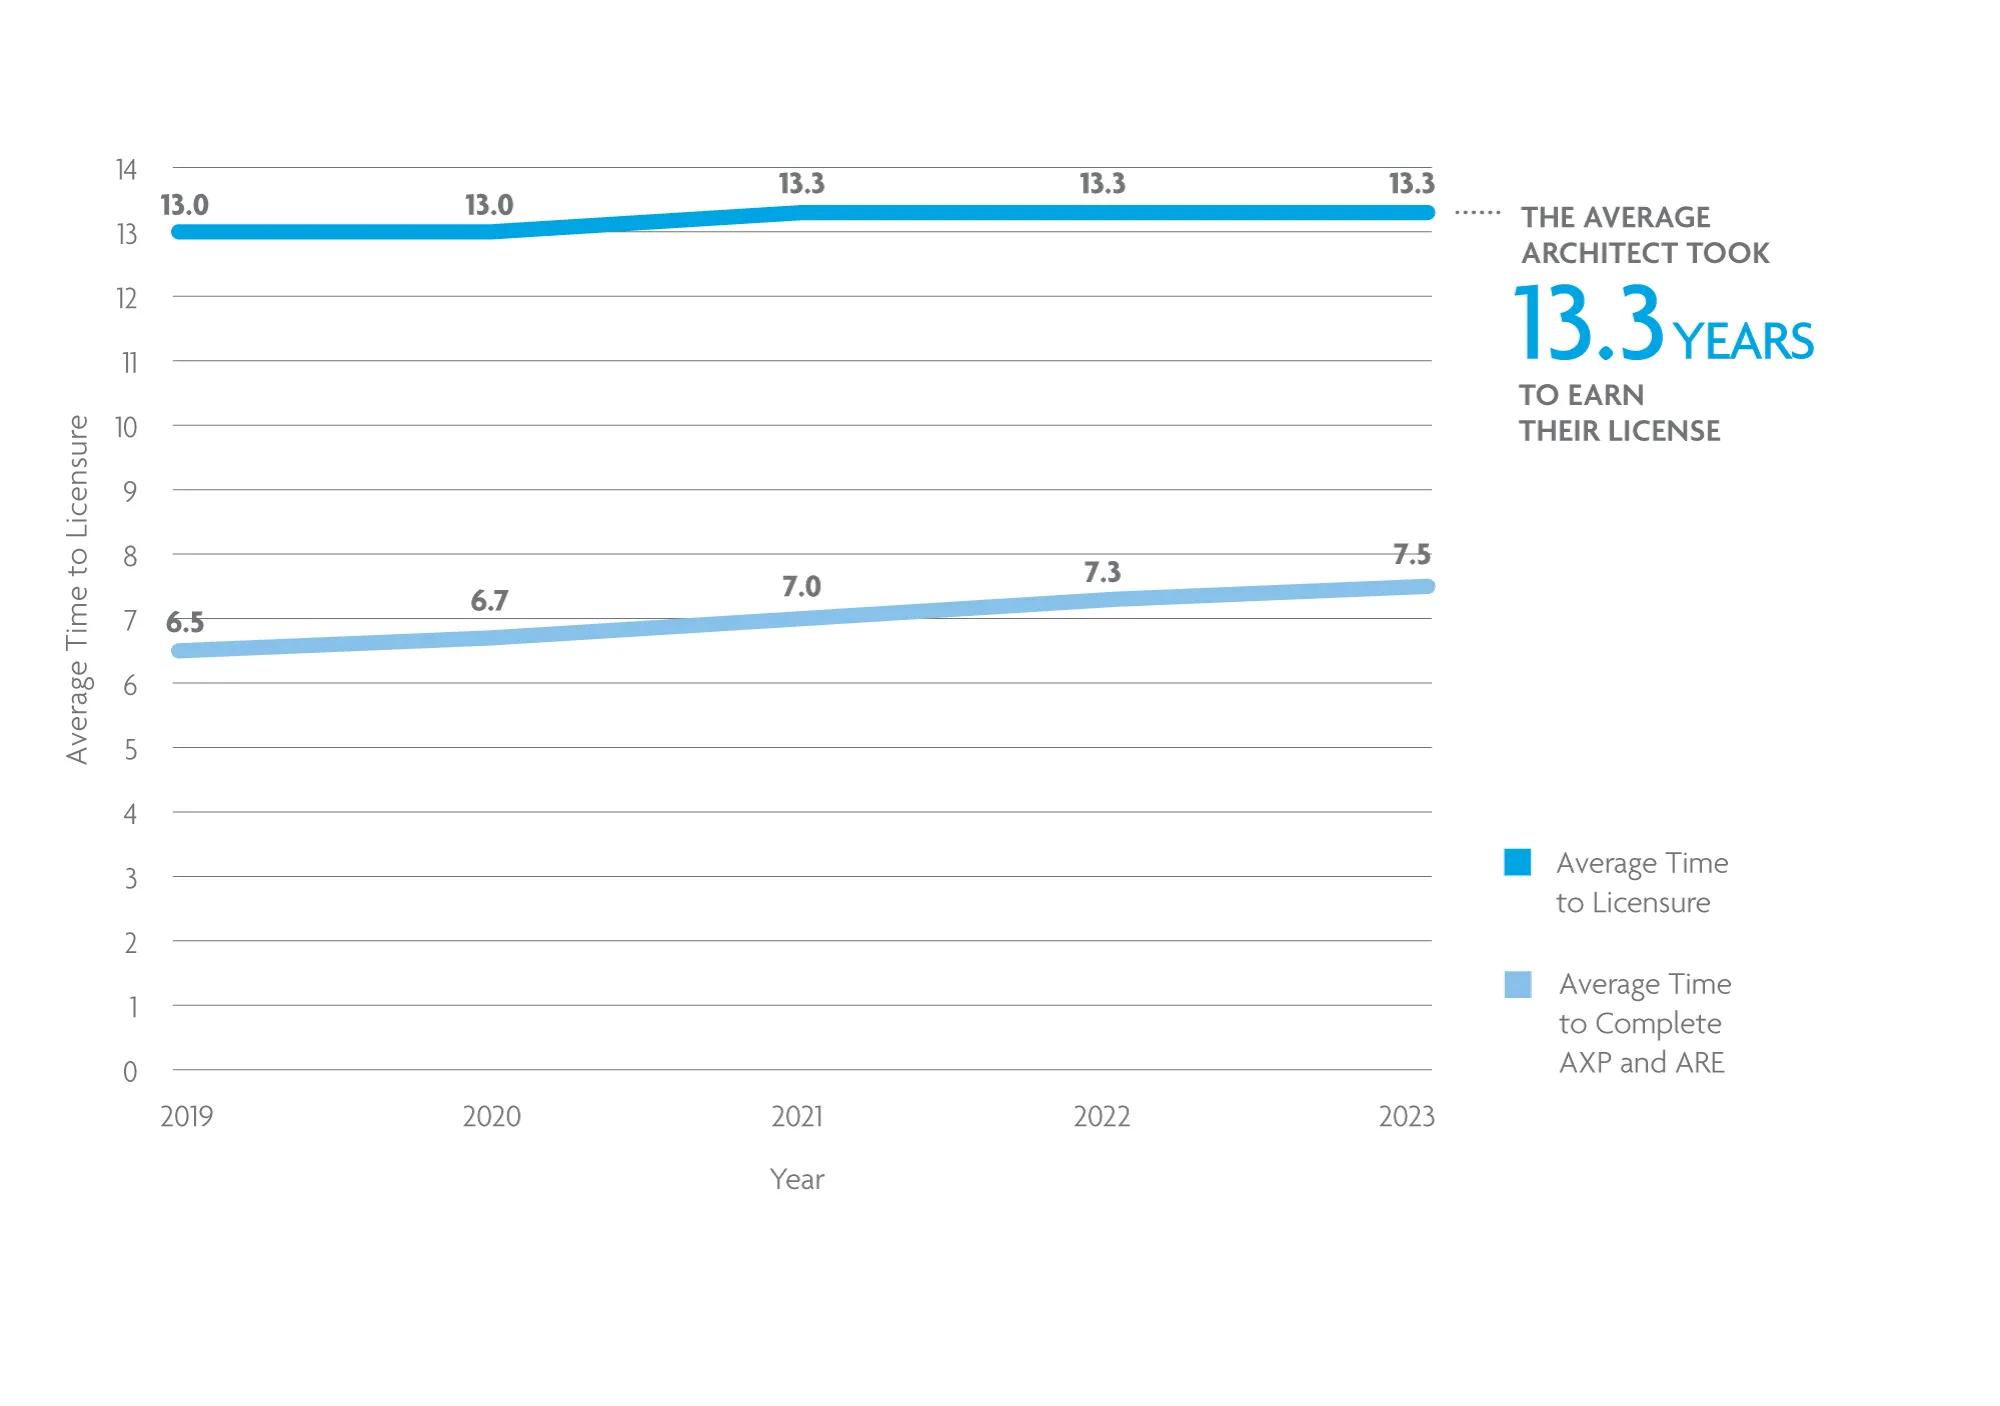
The average time to licensure has held steady at 13.3 years for the past 3 years. However, it is anticipated that time to licensure may fluctuate in the next several years due to competing influences. As the direct impact of the pandemic begins to fade, the time it takes to earn a license may decrease. However, recent programmatic changes like retiring the exam’s 5-year rolling clock for passed exam divisions may provide less incentive for candidates to complete the licensure process quickly, potentially extending the time to licensure.
As NCARB considers other potential programmatic changes for the future, we’re shifting our priority from time to licensure to flexibility of licensure—ensuring that all candidates have an accessible pathway to practice, regardless of background.
DID YOU KNOW? In 2023, the average time to complete NCARB’s programs was 7.5 years, including 4.9 spent completing the AXP and 2.5 spent completing the ARE—5 months shorter than the average time to complete the ARE in 2022.
The number of reciprocal licenses fell by 2%.
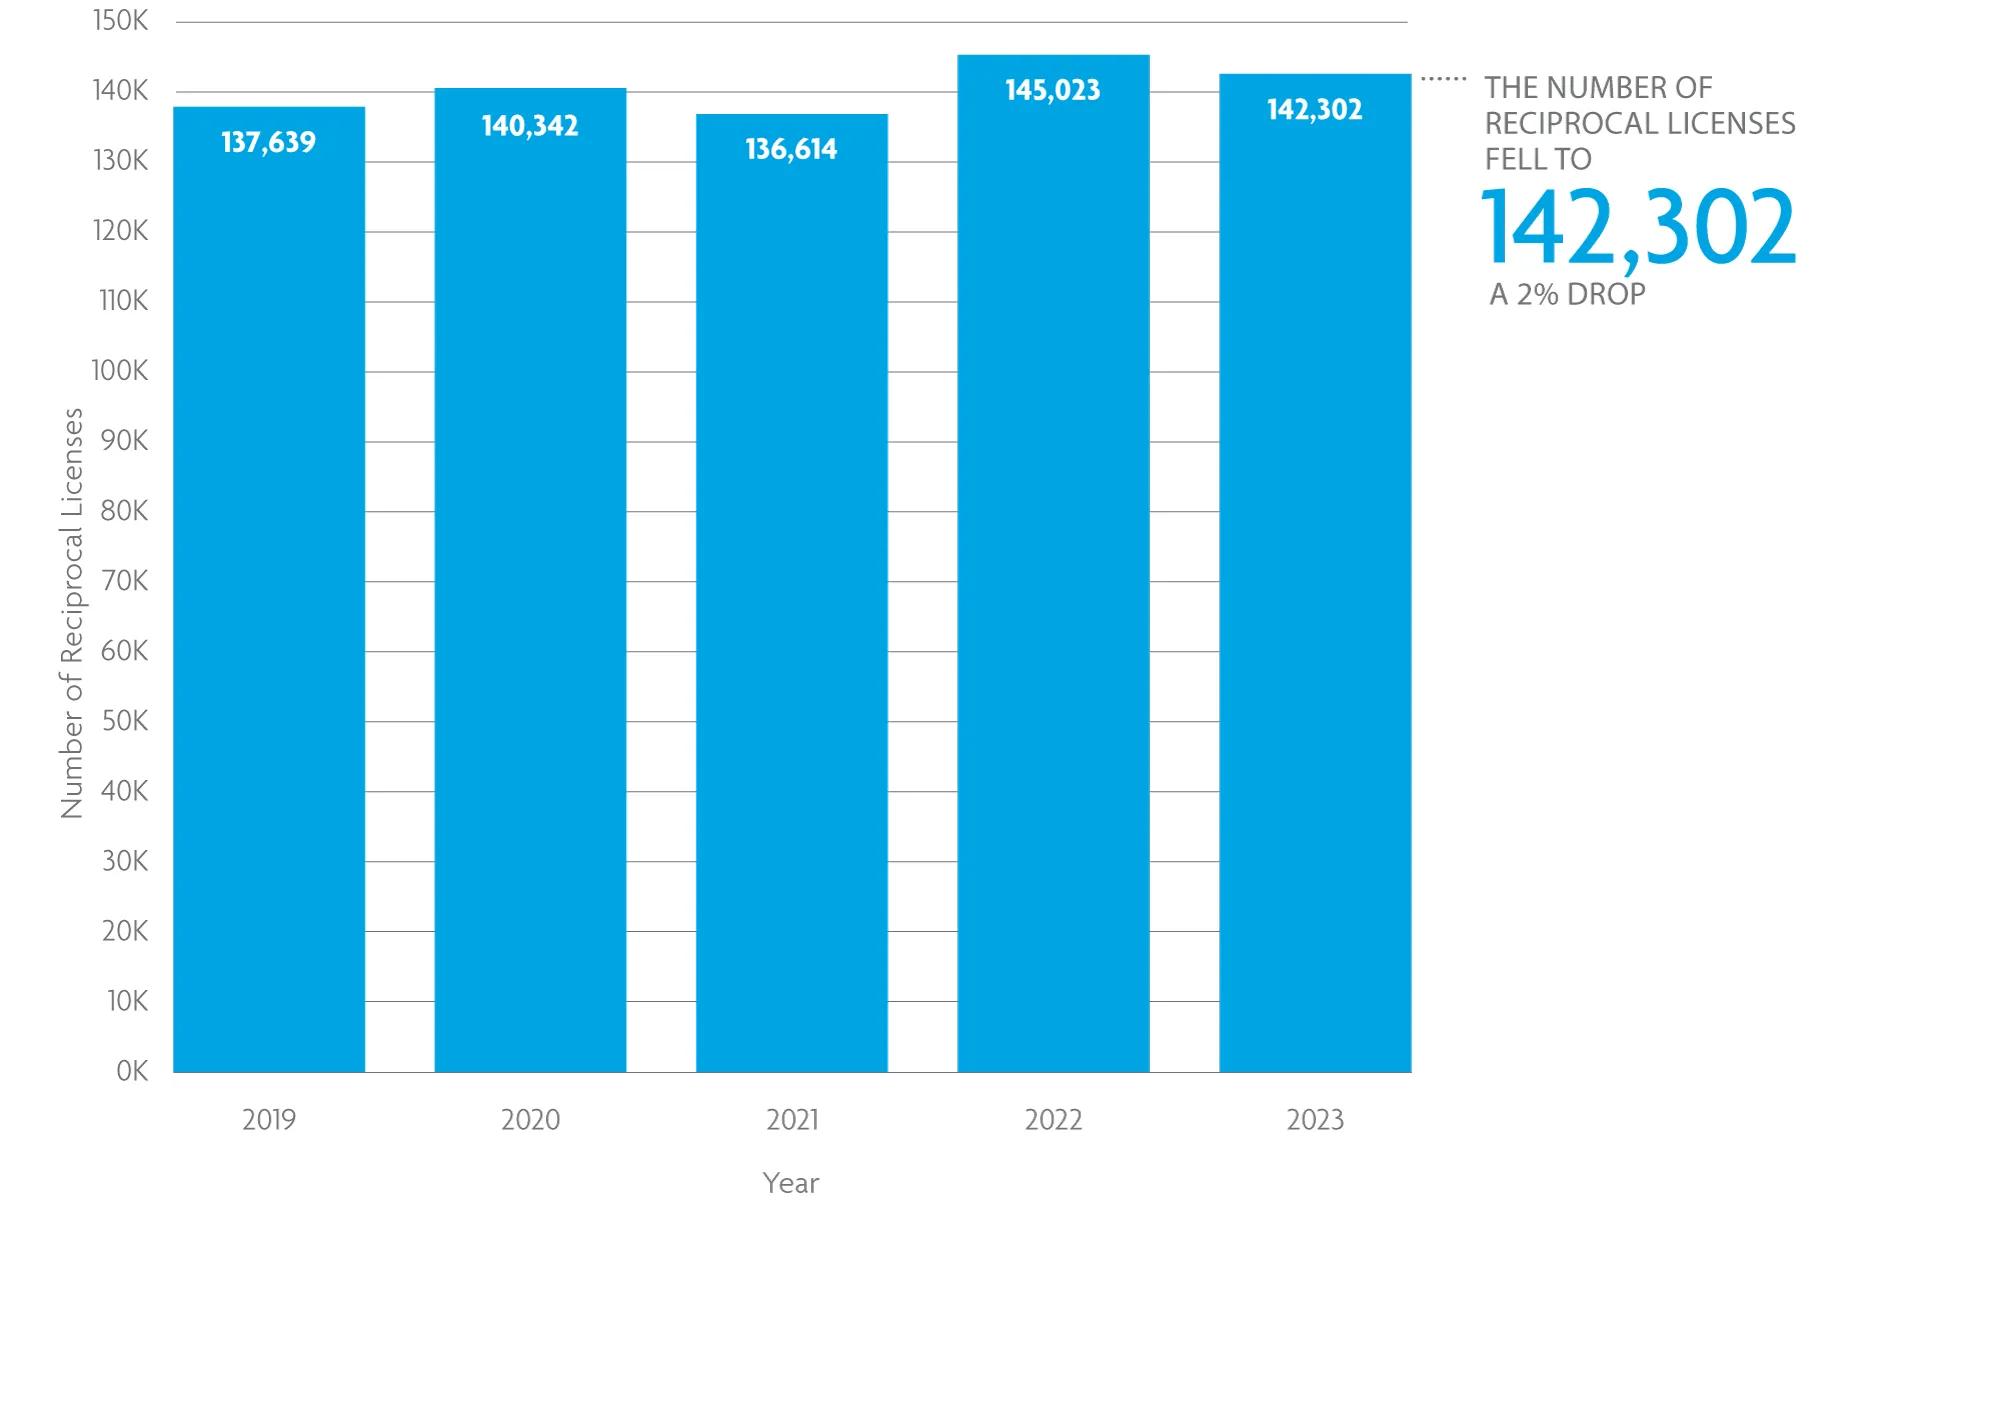
Many architects are licensed in more than one state, which allows them to meet existing clients’ needs and expand their potential client base. In 2023, the number of out-of-state (or reciprocal) licenses fell by 2%, according to NCARB’s annual Survey of Architectural Registration Boards.
This year’s decrease follows a 6% increase seen in 2022. Historically, NCARB has often seen a slight decrease following a year of growth, so 2023’s drop is likely a part of this pattern as architects respond to ebbs and flows in client demand. NCARB’s data also suggests that retiring architects may forego some of their reciprocal licenses but maintain licensure in their primary state of residency.
Over 10 years, 36% of candidates stopped pursuing a license.
NCARB tracks candidate activity on the path to licensure to identify potential impediments that might be preventing candidates from becoming architects. While some changes in career plan or field are expected, ideally, NCARB would see a similar level of attrition across demographic groups.
More than a third of candidates stop pursuing licensure over a 10-year period.

In 2023, 48% of individuals who started the path to licensure 5 years ago (in 2019) were still actively working toward earning their license, and 38% were no longer pursuing licensure. For candidates who started the licensure path 10 years ago (in 2014), 22% were still actively working toward earning their license, and 36% were no longer working pursuing licensure.
Compared to 2022’s attrition data, this represents a slight increase in the proportion of candidates who have finished the licensure path at both the 5- and 10-year mark. However, the proportion of candidates who stop pursuing a license is relatively unchanged. The higher rates of attrition for those who only started 5 years ago compared to those who started the licensure path 10 years ago may reflect the impact of the pandemic.
White candidates are twice as likely as Black candidates to be licensed after 10 years.
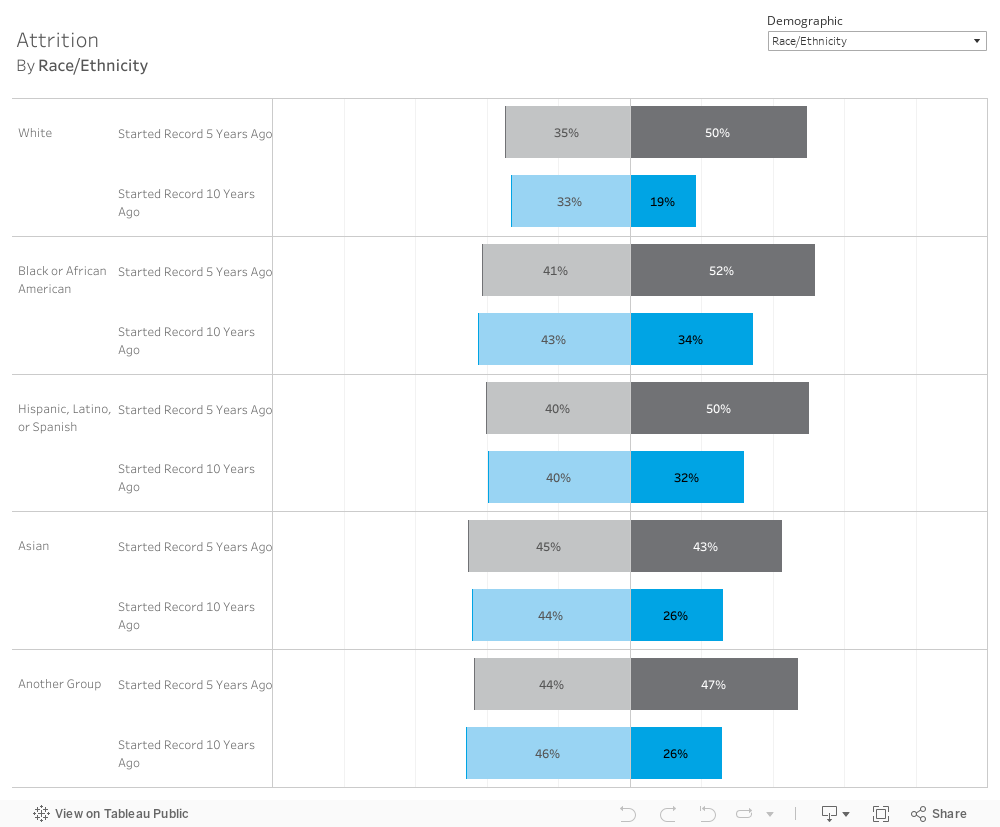
While attrition from the licensure path is equal for men and women, there are some disparities based on racial and ethnic identity. Compared to their peers, white candidates are far more likely to be licensed at the 10-year mark. In 2023, 48% of white candidates were licensed after 10 years, compared to 23% of Black or African American candidates. People of color were more likely than their white peers to stop pursuing licensure over a 10-year period, with candidates who identified as some other group the most likely at 46%. Black or African American candidates were the most likely to be actively pursuing licensure at the 10-year mark: 34% of Black or African American candidates who started the path to licensure in 2014 were actively testing or reporting experience in 2023.
When it comes to attrition on the path to licensure, there are no significant disparities between genders. Women and men have had nearly equal rates of attrition at the 10-year mark for the past several years, with 36-37% of both groups no longer working toward licensure. Interestingly, women are slightly more likely than men to be active at the 5-year mark.
Where are the non-binary candidates? Currently, less than 0.5% of licensure candidates have identified as non-binary. Because of the small sample size, we can’t share licensure statistics for non-binary candidates.
Black candidates are most likely to keep pursuing their licensure goals.
For licensure candidates who started their NCARB Record between 5-10 years ago but haven’t earned a license yet, navigating the experience program is the most common pinch point. Asian candidates are most likely to stop pursuing licensure while completing the AXP: 21% of current Asian candidates who started the licensure process between 2014-2019 fell off the path while documenting experience.
By contrast, Black or African American candidates were more likely to continue pursuing a license compared to their peers: 56% of current Black or African American candidates who started the licensure process between 2014-2019 are still working toward licensure, compared to 47% of Asian candidates.
When comparing men and women who started their NCARB Record between 5-10 years ago but haven’t earned a license yet, rates of attrition are nearly equal at every stage of the licensure path. Overall, women are 2 percentage points more likely than men to continue pursuing their licensure goals.