
Over the past several years, NCARB has implemented several changes to improve equity and diversity on the path to licensure—with the ultimate goal of improving representation among licensed practitioners. Greater diversity in the candidate population is beginning to make its way to the pool of licensed architects: in 2023, 1 in 5 architects identified as a person of color.
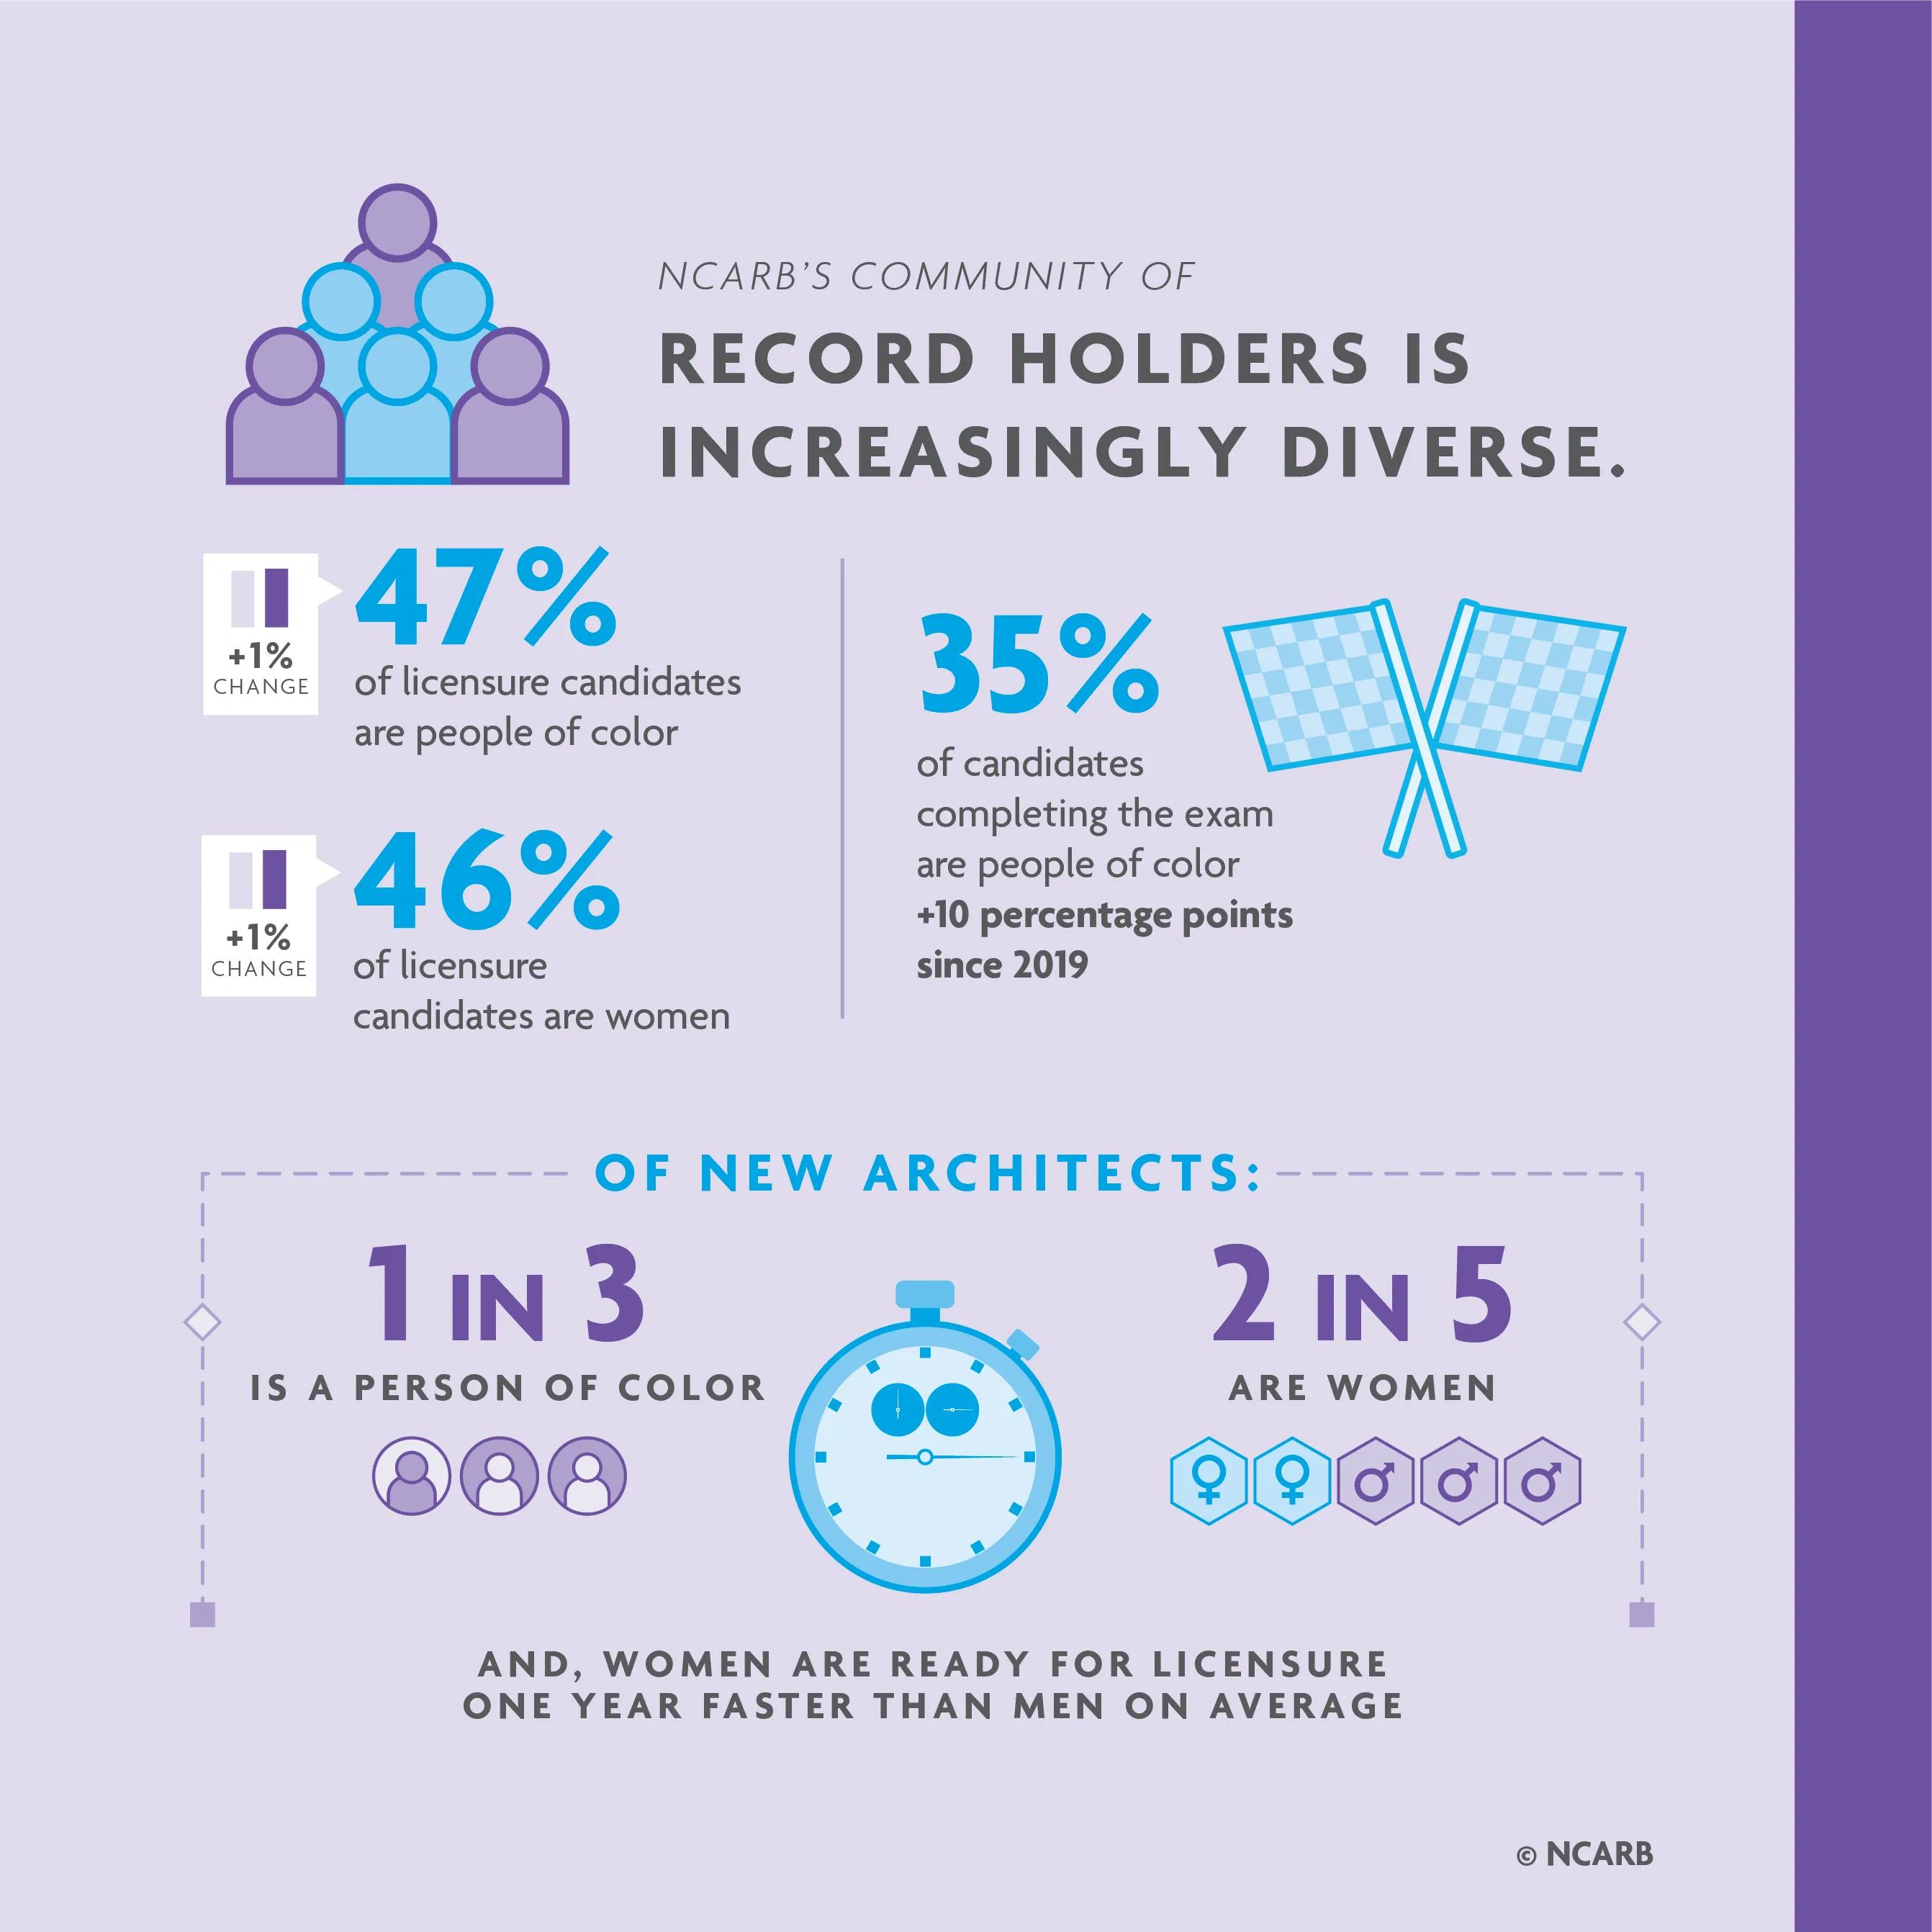
NCARB has seen consistent growth in gender equity and racial diversity across all candidate stages over the past 5 years. As candidates progress along the licensure path, these increases become more and more apparent in the profession. In 2023, 47% of the licensure candidate population identified as a person of color, and 46% were women.
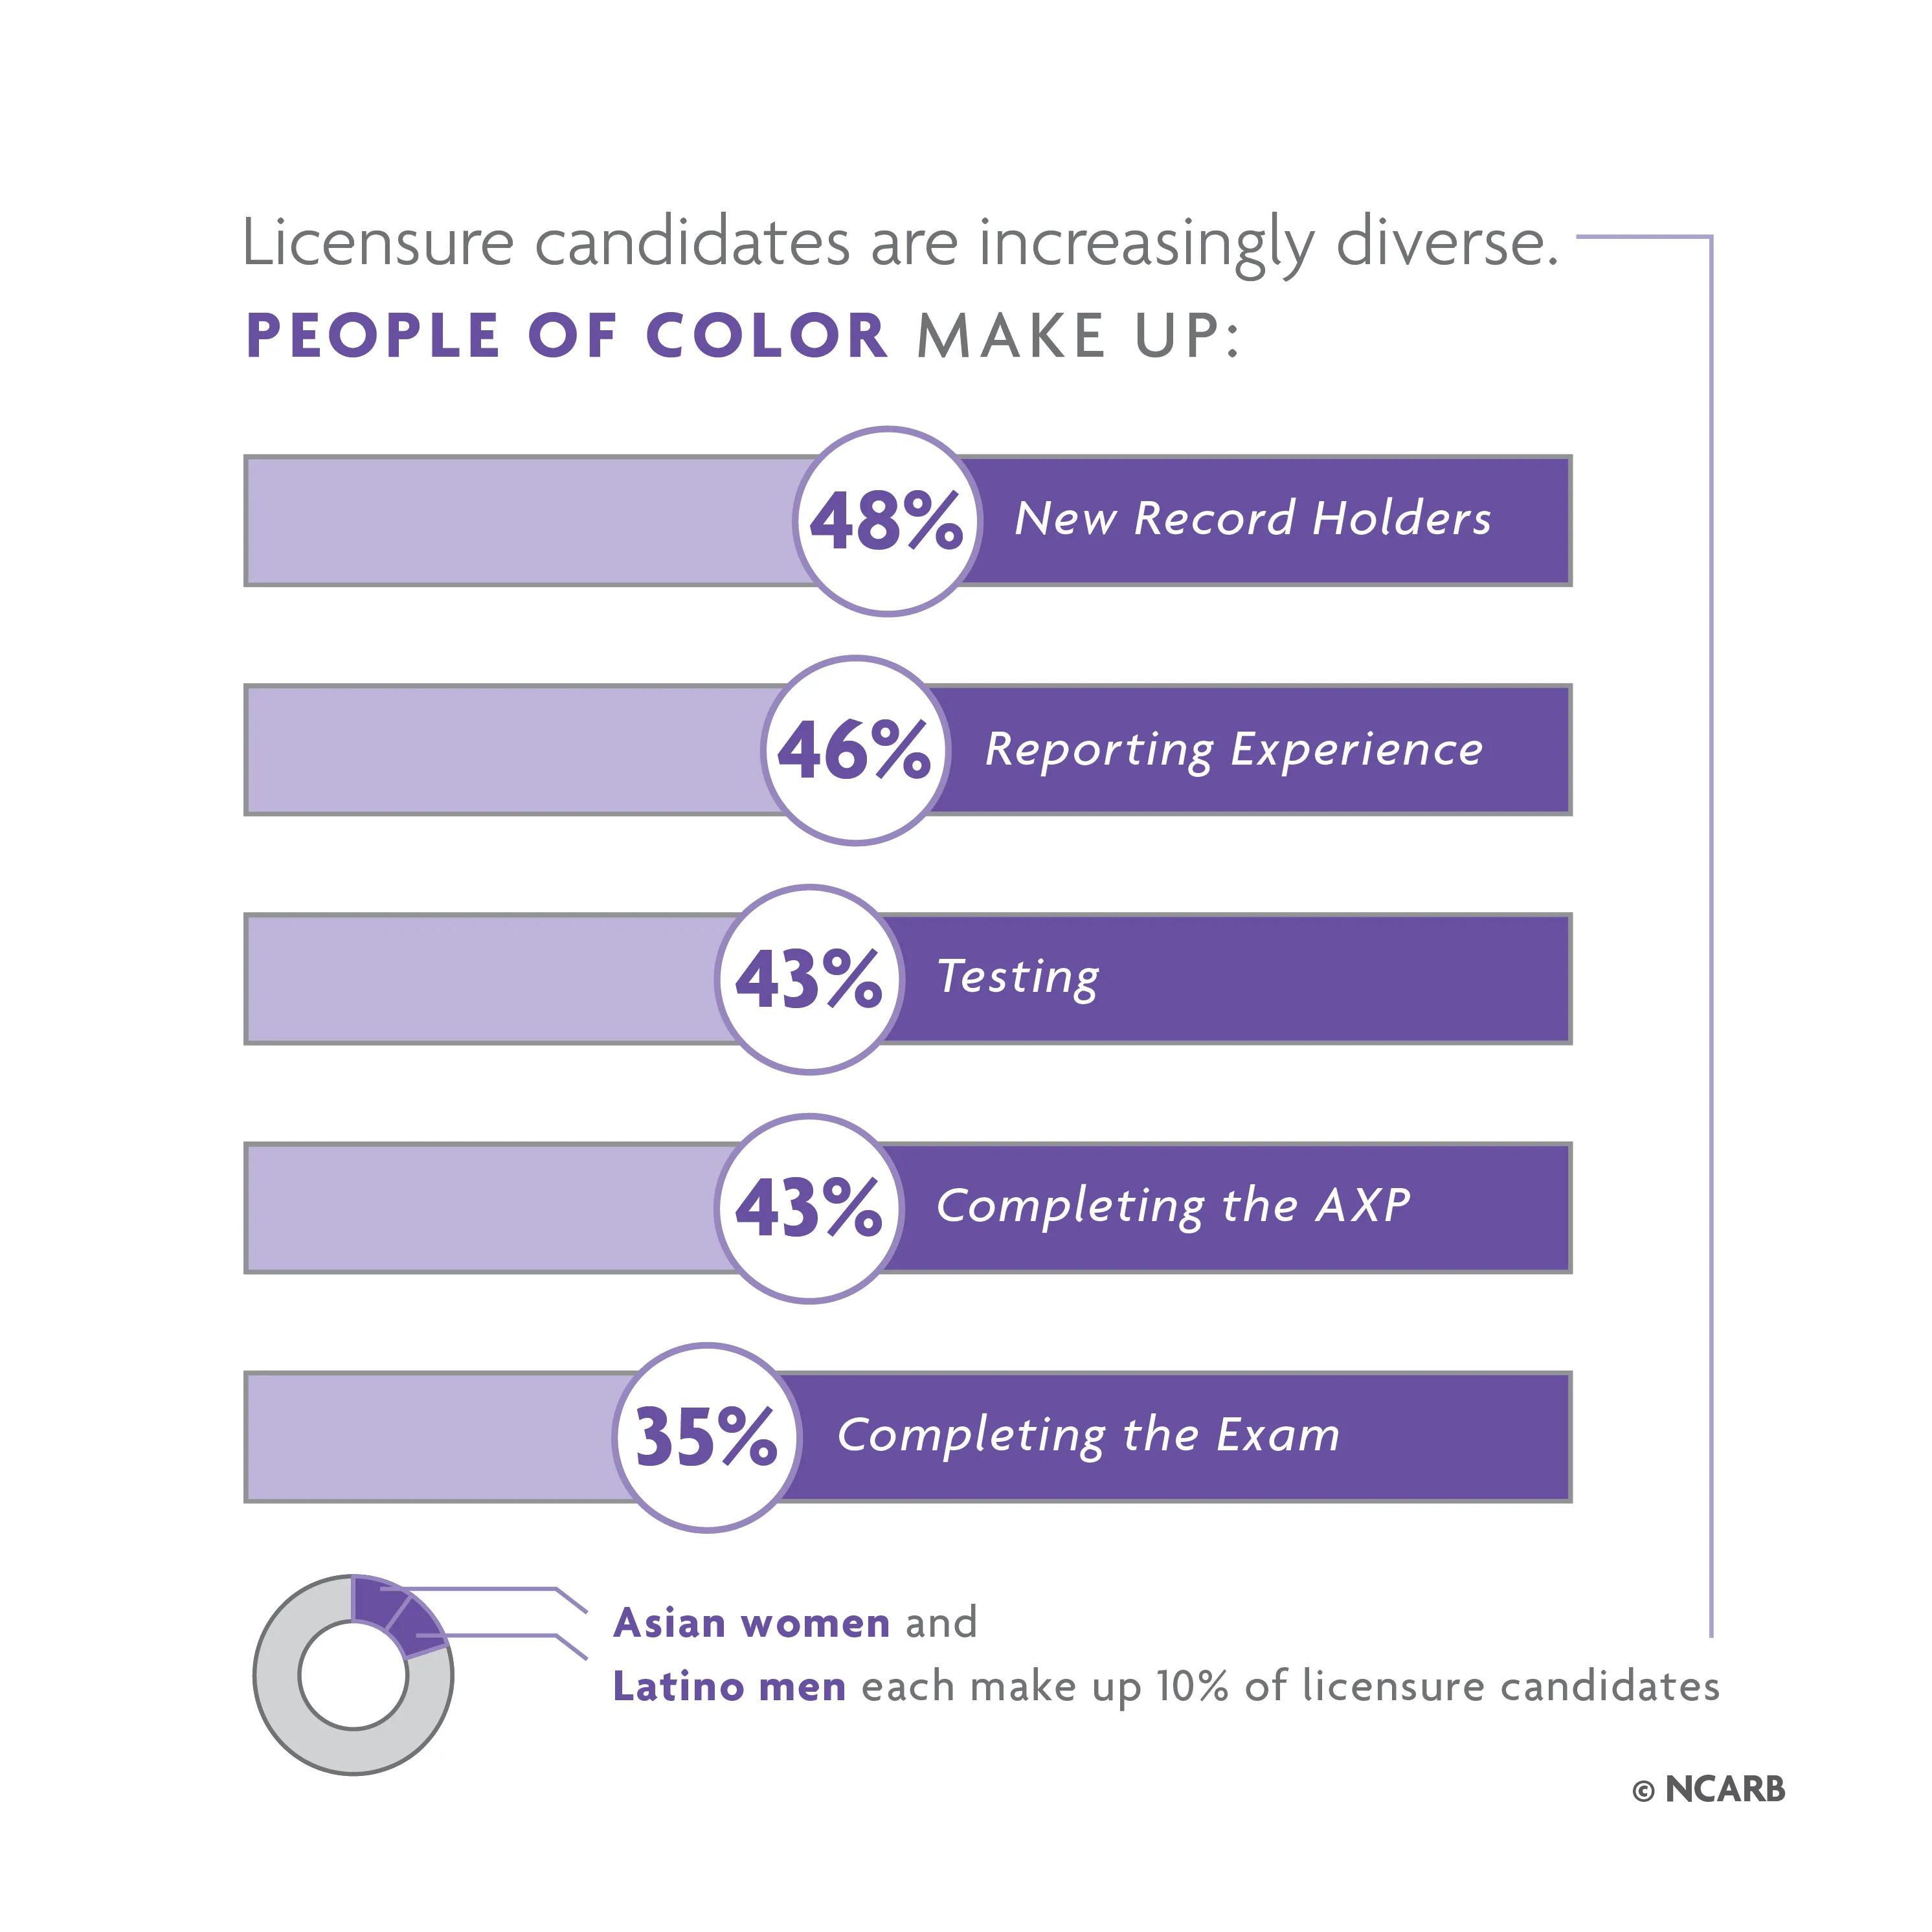
Women now make up 48% of the testing population, and typically earn their licenses faster than men—completing requirements a year sooner on average. In 2023, nearly half (43%) of candidates completing the AXP and over a third (35%) of candidates completing the ARE identified as a person of color.
One in Five Architects Identifies as a Person of Color
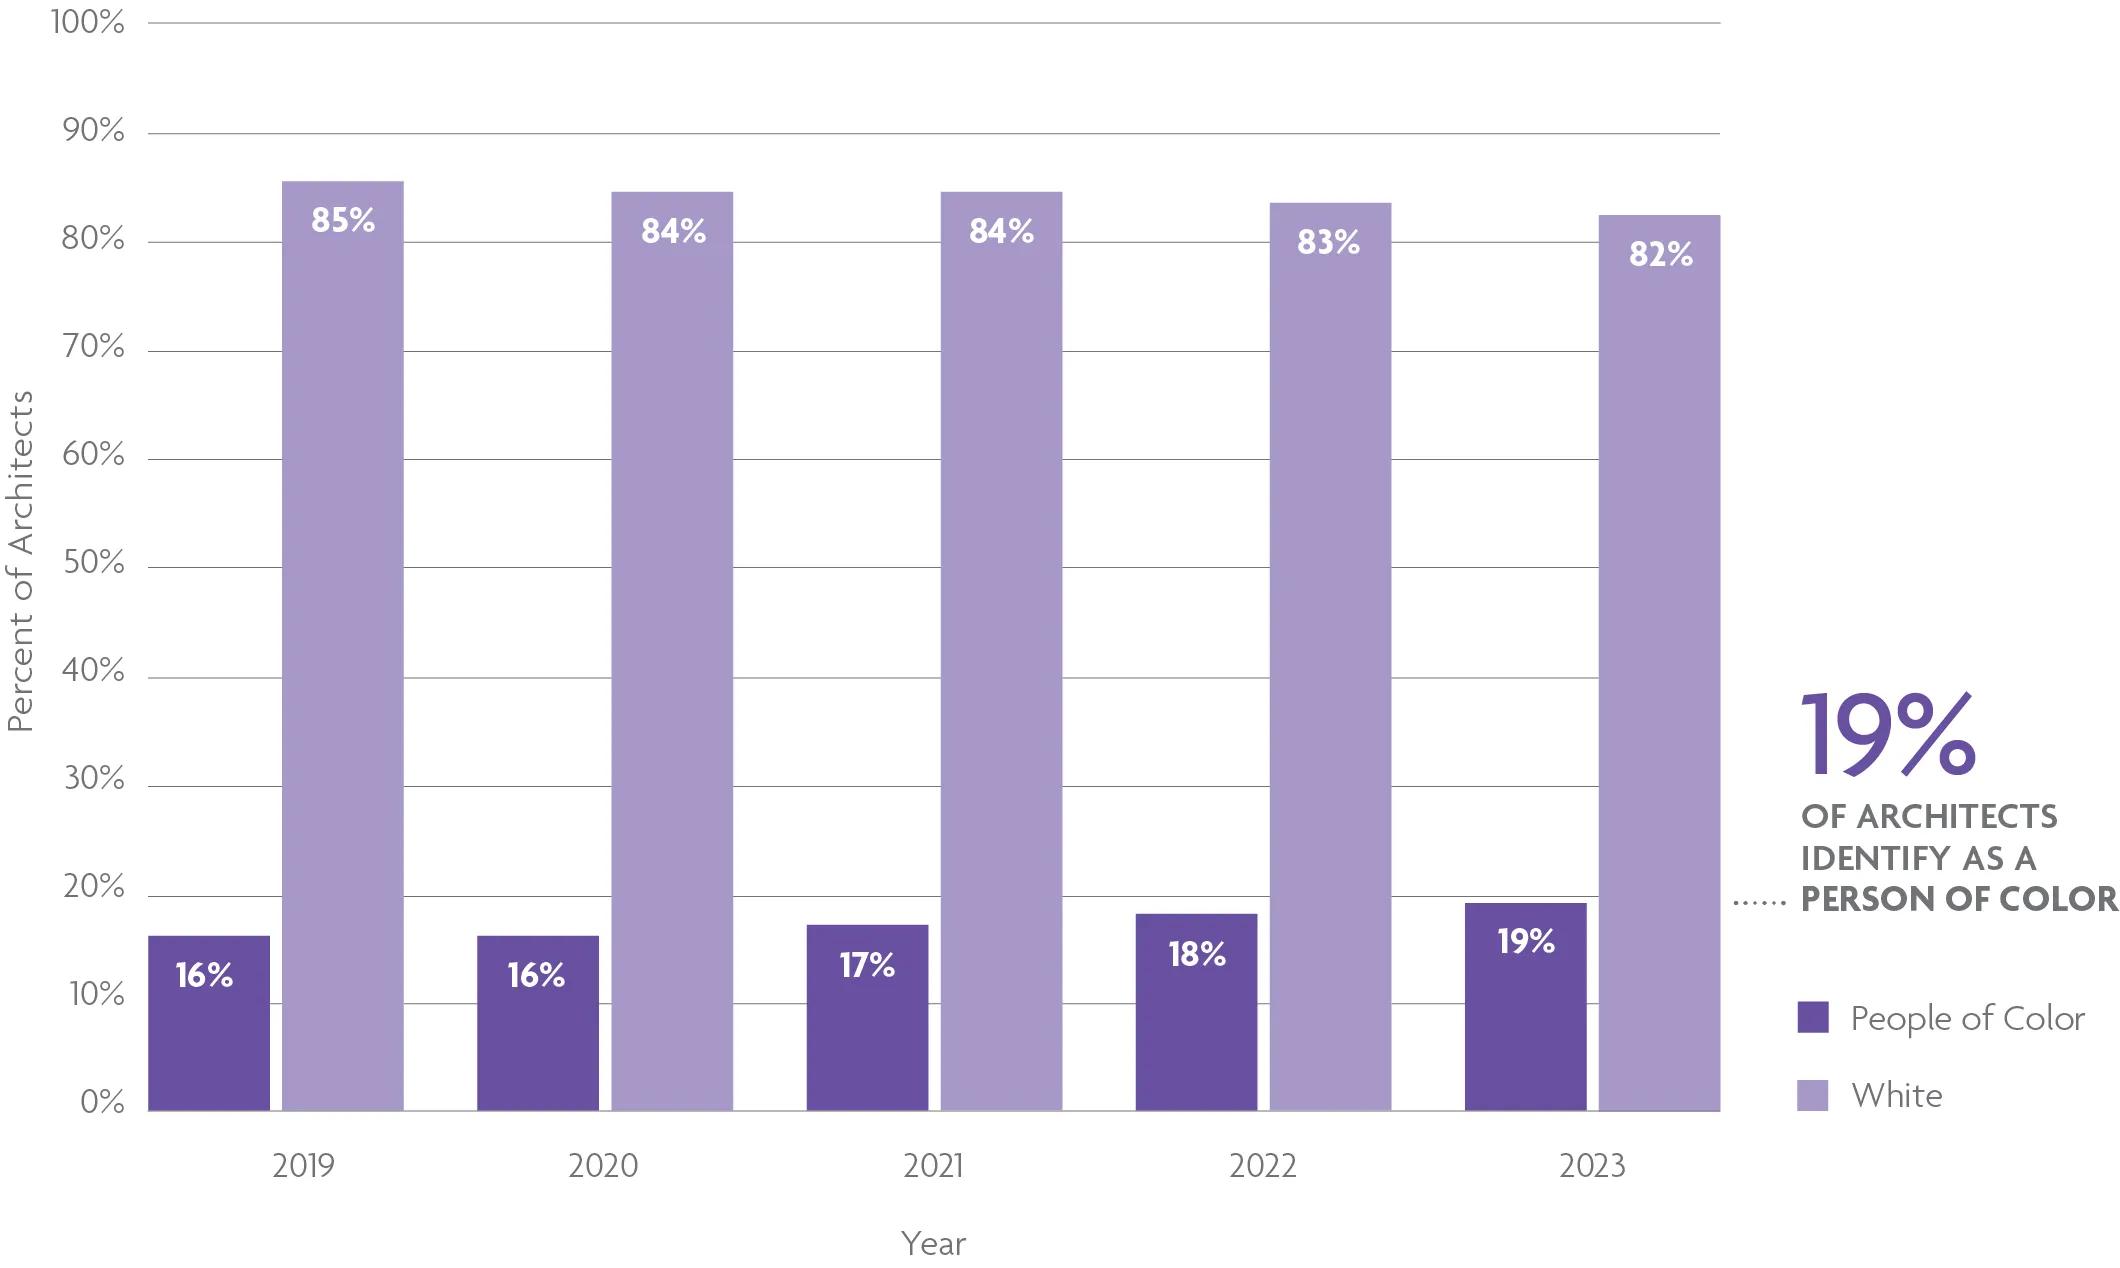
In 2023, people of color (POC) comprised 19% of the total architect population—a 3 percentage point increase compared to the number seen 5 years ago, and 1 percentage point more than last year. While the significant majority of the architect population identifies as white, this makeup has been slowly shifting over time.
DID YOU KNOW? “People of color” includes anyone who identifies as a race or ethnicity other than white. Because individuals can identify as part of more than one racial or ethnic group, these percentages can add to more than 100%.
More Than a Quarter of U.S. Architects Are Women
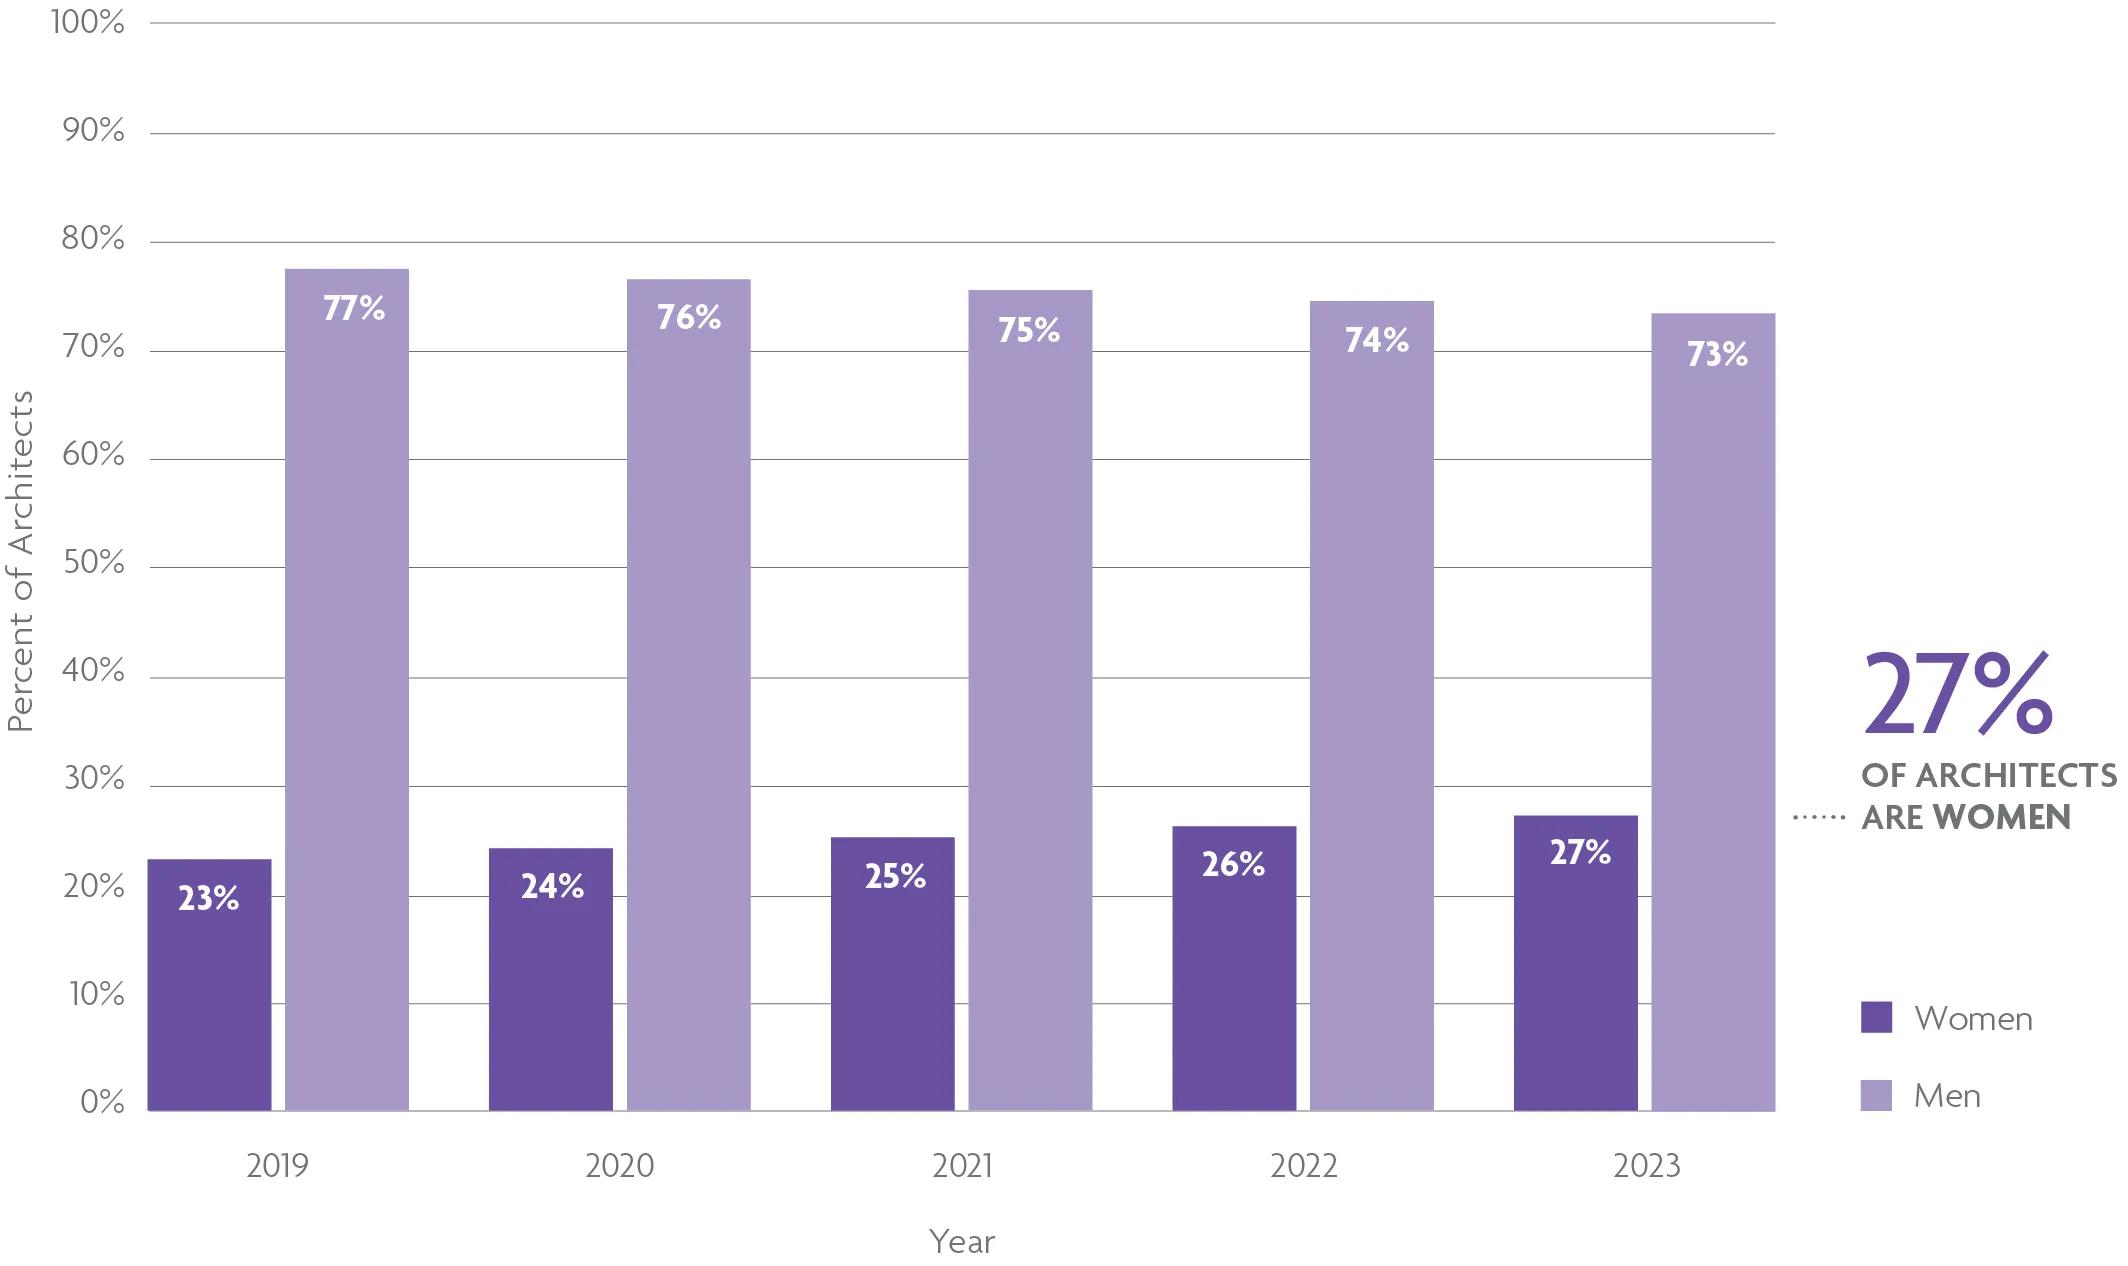
Note: Non-binary individuals make up less than .05% of the architect population—which is below our threshold for the minimum sample size (which is 30 individuals).
In 2023, women made up 27% of the total architect population—a 1 percentage point increase compared to 2022. Over the past 5 years, the architect population has shown a continuous trend toward greater gender parity, with women now making up more than a quarter of the architect population.
Architect Population on a Steady Trend Toward Racial and Ethnic Diversity
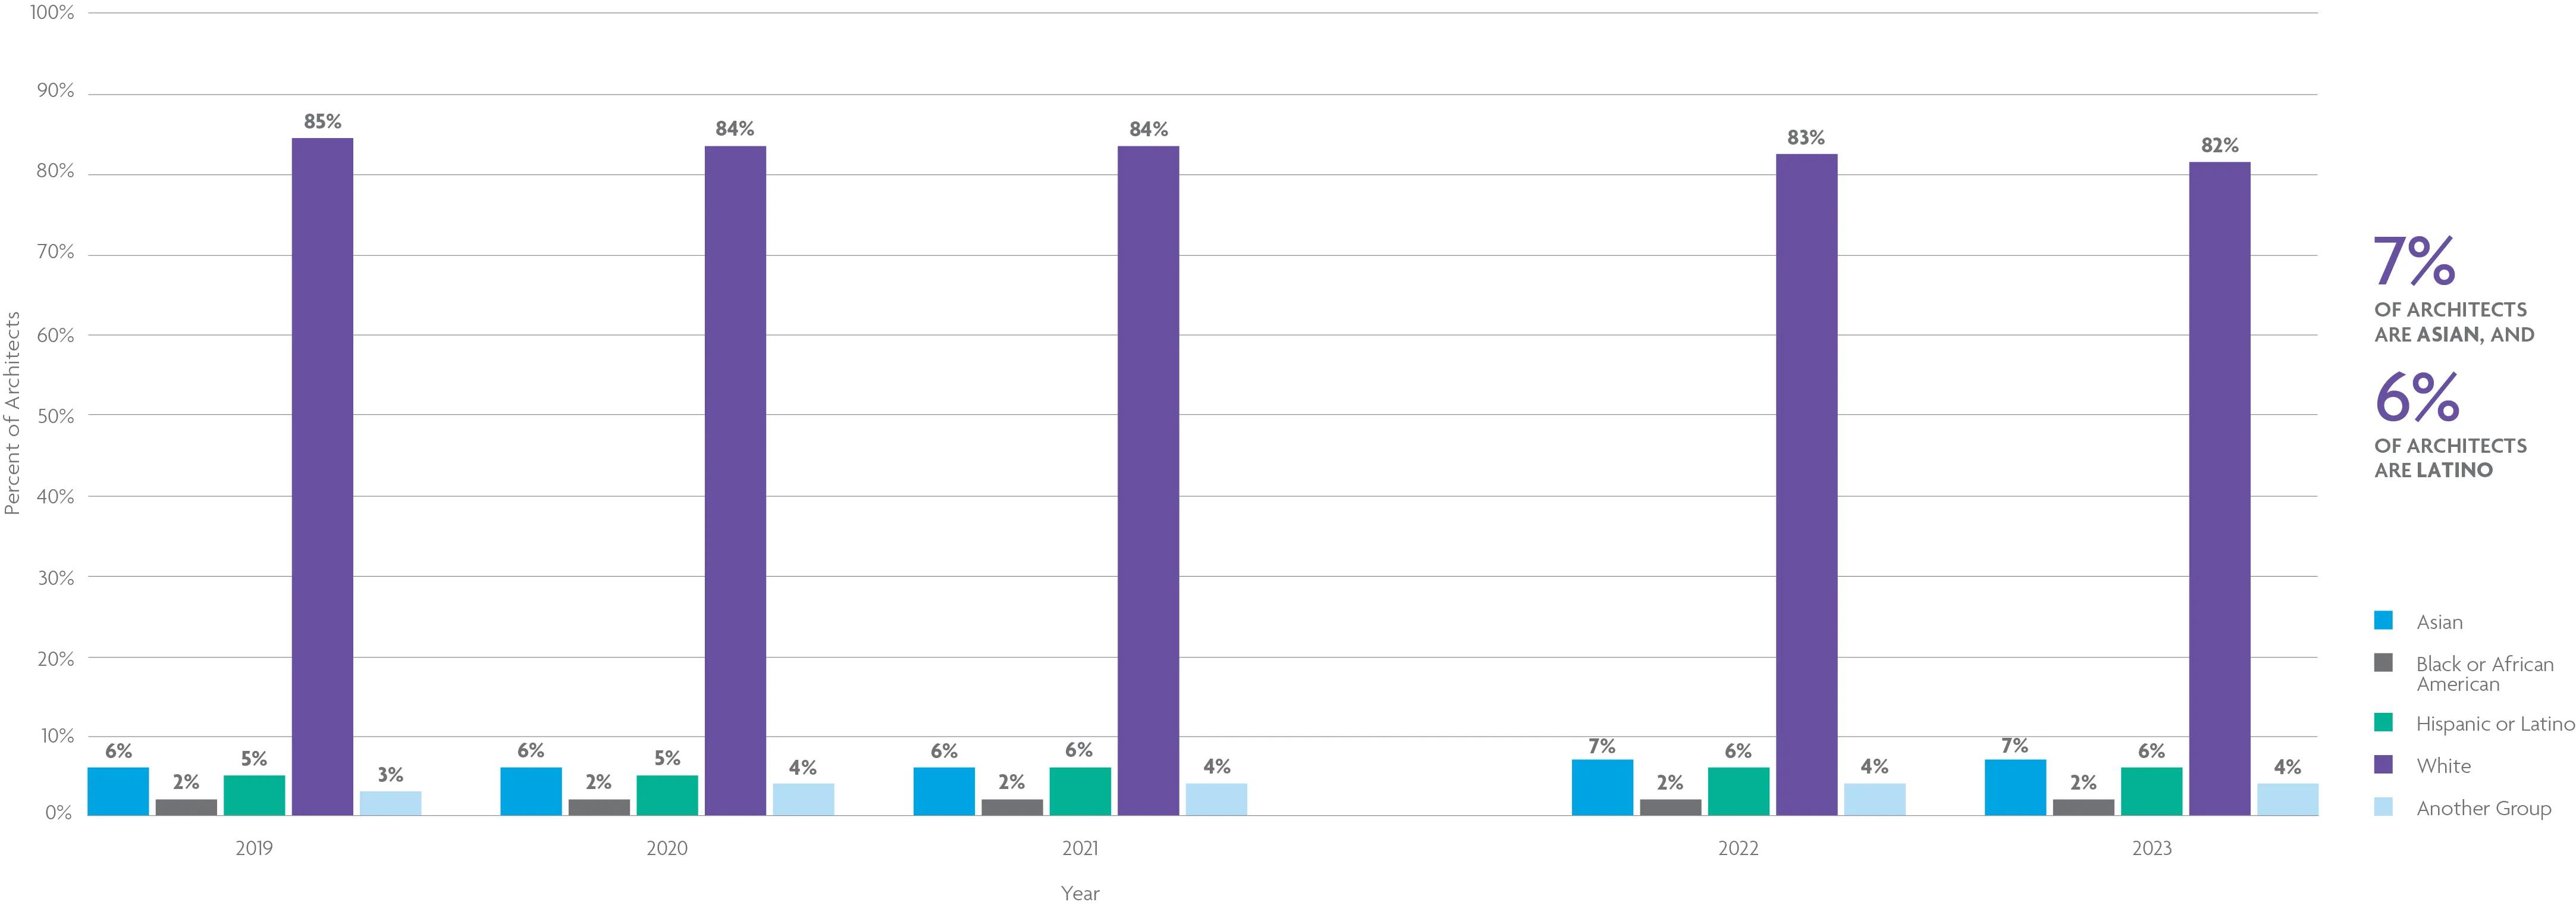
Breaking down demographics of the total architect population further shows slight growth in the Asian and Latino populations: these groups made up 7% and 6% of the architect population, respectively. However, the proportion of Black or African American architects has seen little change over the past 5 years, with Black architects making up just 2% of practitioners.
DID YOU KNOW?
- “Another group” includes architects who identify as any group that is too small to include on its own, as well as those who self-identify.
- NCARB uses the NCARB Certificate holder population as an approximation for the architect population.
Nearly Two-Thirds of U.S. Architects Are White Men
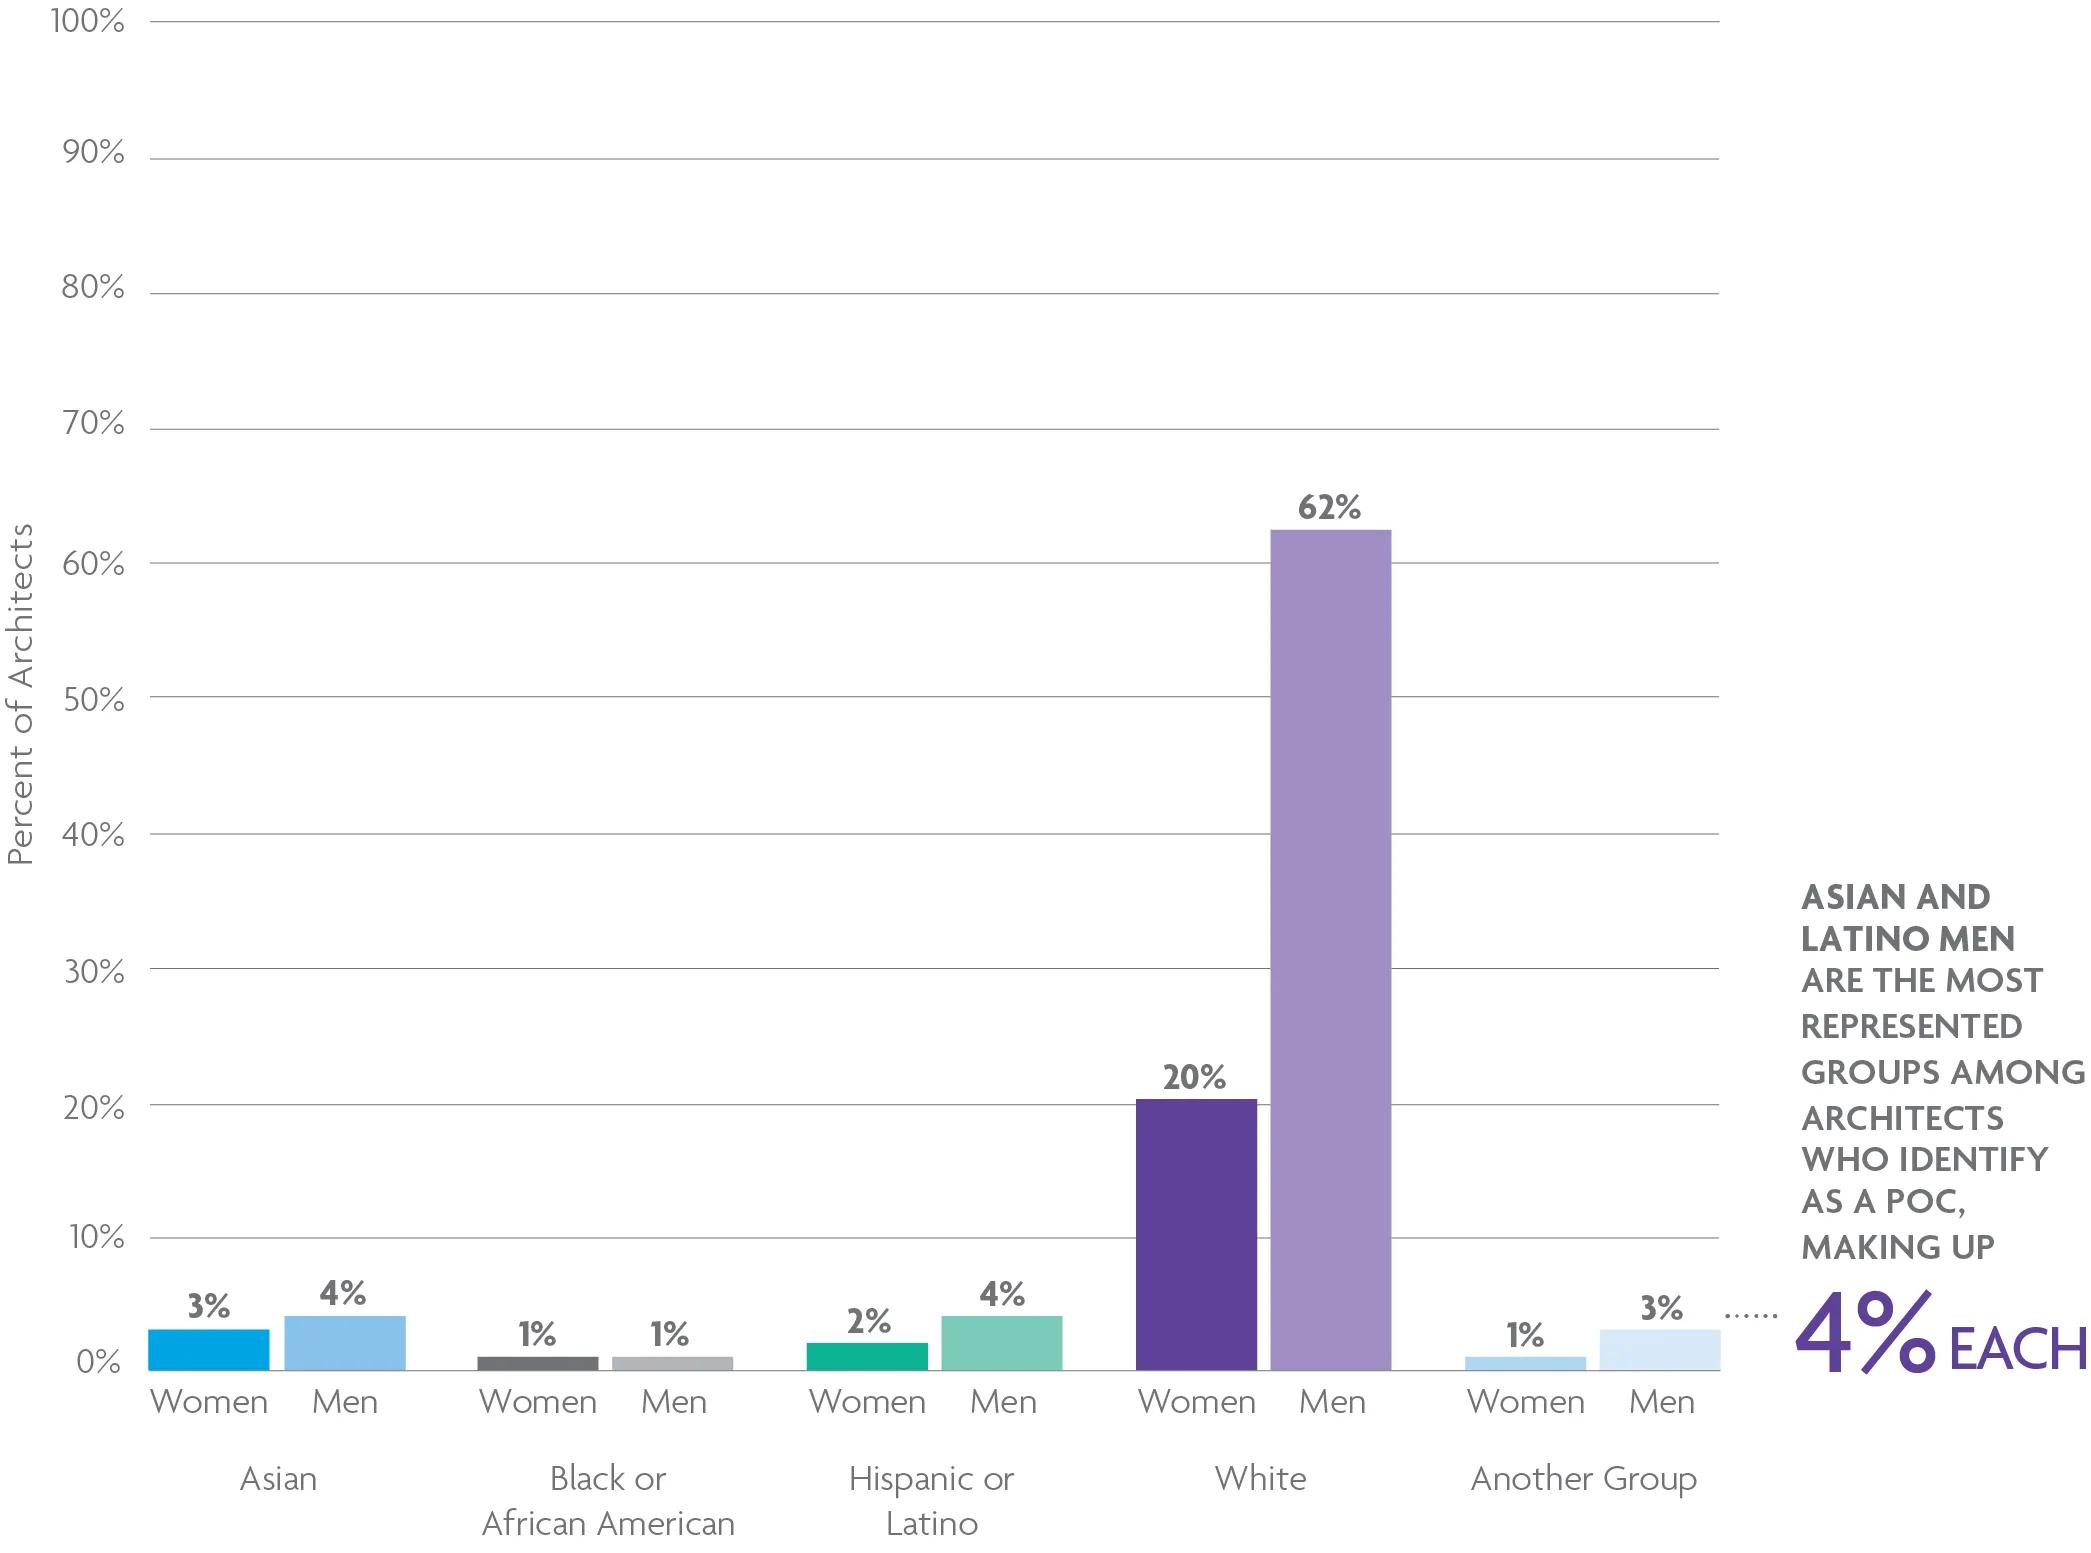
White men have historically been the most represented demographic group in architecture. In 2023, they made up 62% of all U.S. architects. However, representation for other demographic groups continues to improve. Asian and Latino men are the most represented groups among architects who identify as a person of color, making up 4% of practitioners each.
Black or African American men and women are among the most underrepresented groups in architecture, making up approximately 1% of the architect population each.
White Candidates Earn Their License in Less Time
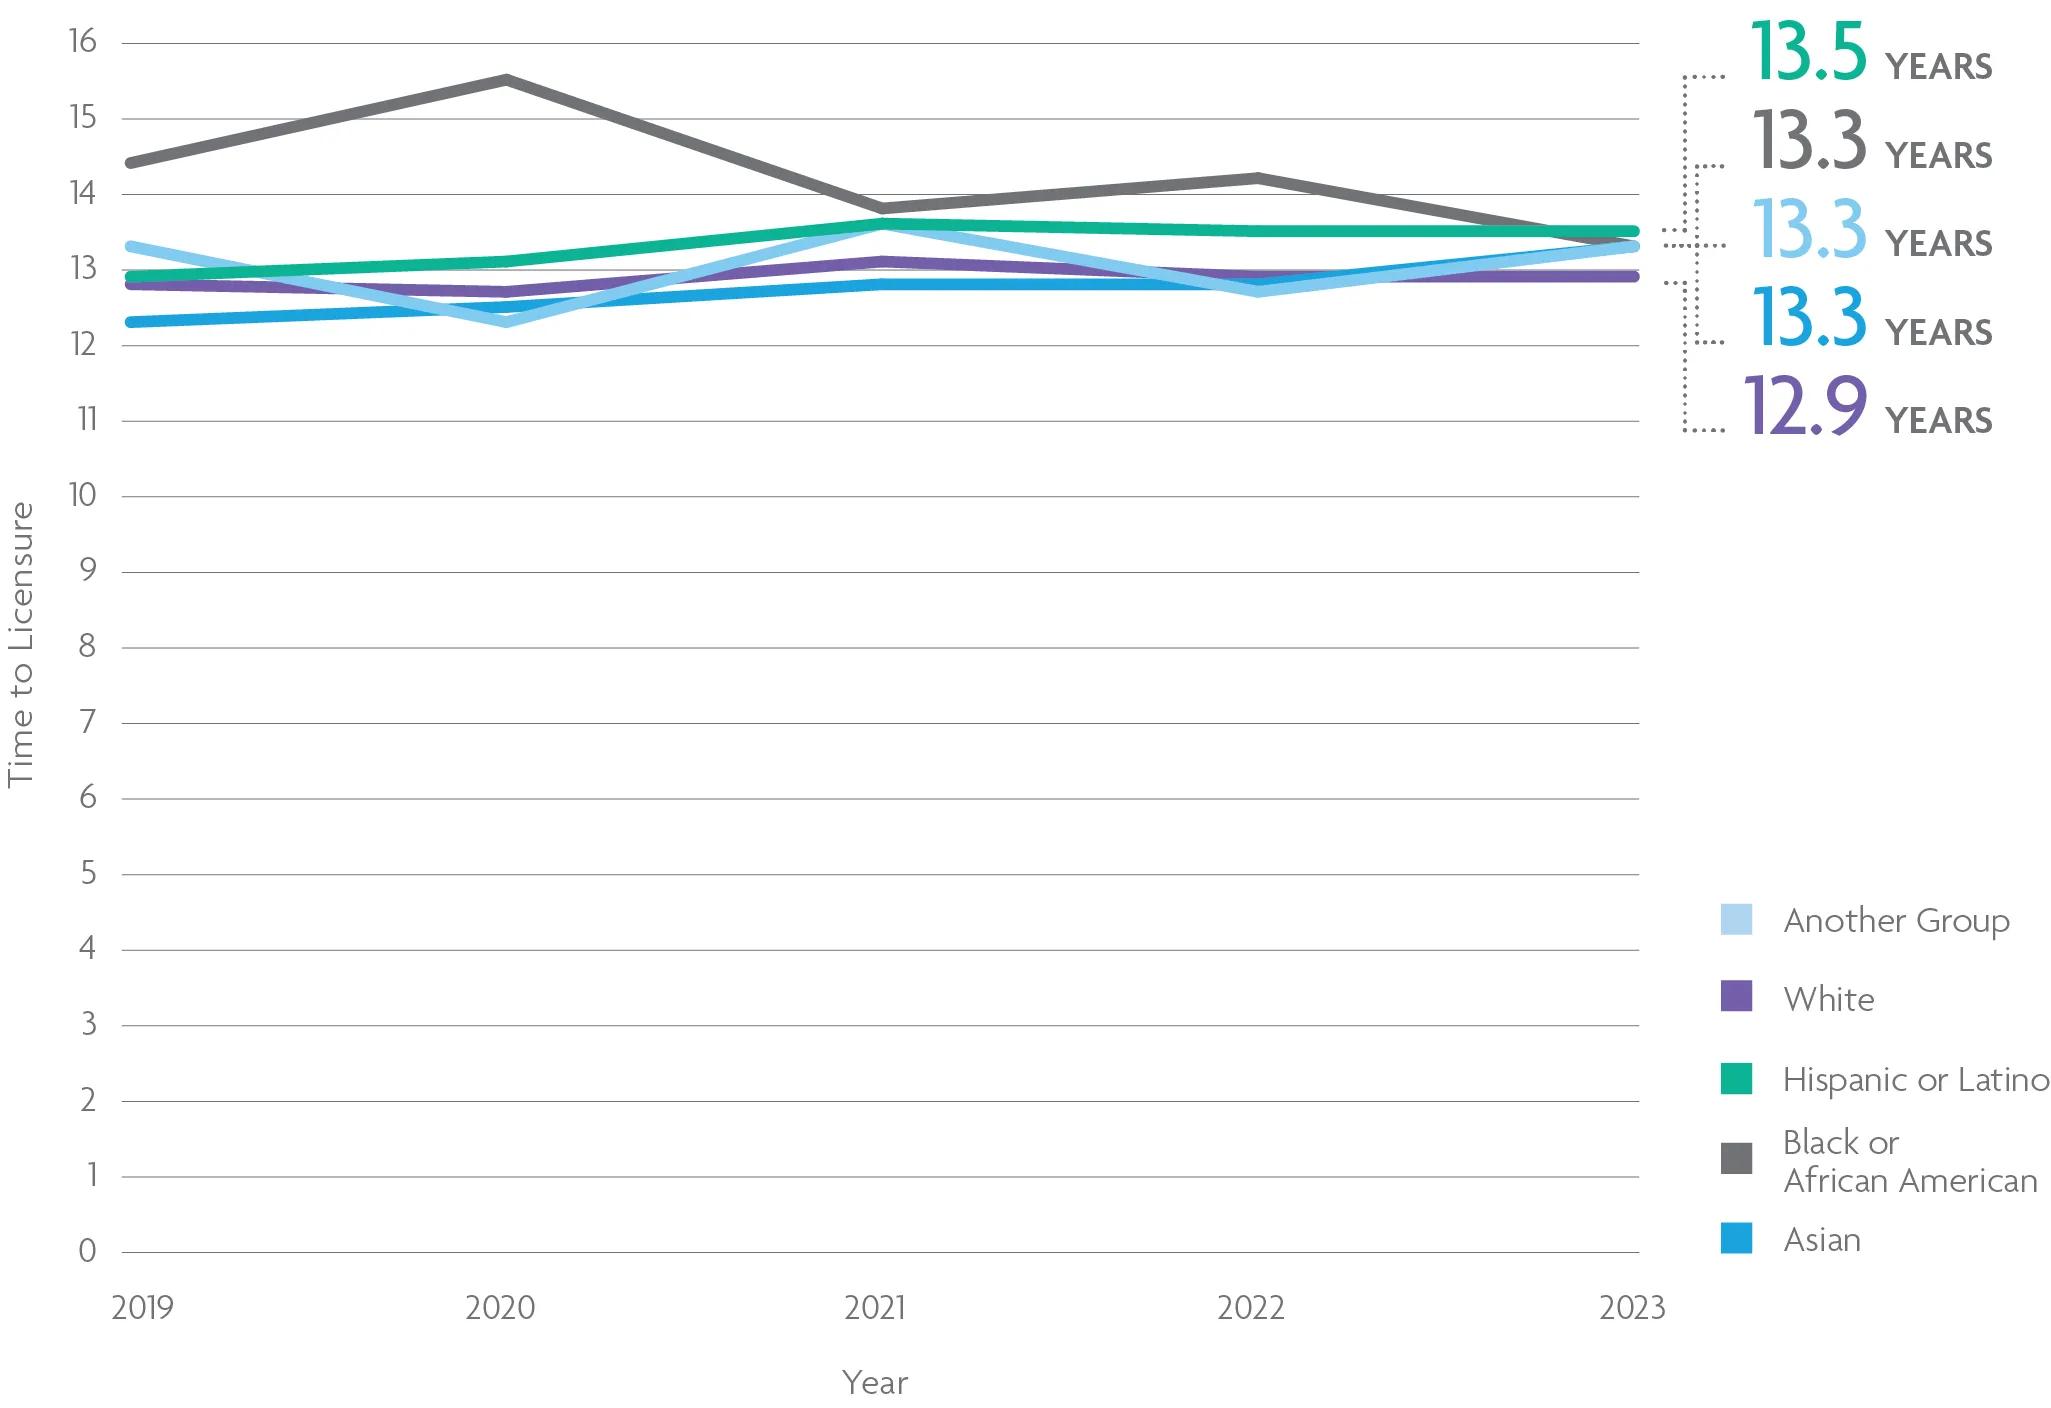
The average white candidate who completed the licensure path in 2023 took 12.9 years to do so. In comparison, Asian and Black candidates took 13.3 years, approximately 4 months longer. Hispanic or Latino candidates took the longest at 13.5 years, 6 months longer than their white peers.
Note: Because the sample size for underrepresented demographic groups is much smaller, the average time to licensure for these groups tends to fluctuate more significantly from year to year.
Women Consistently Earn Their Licenses Faster Than Men
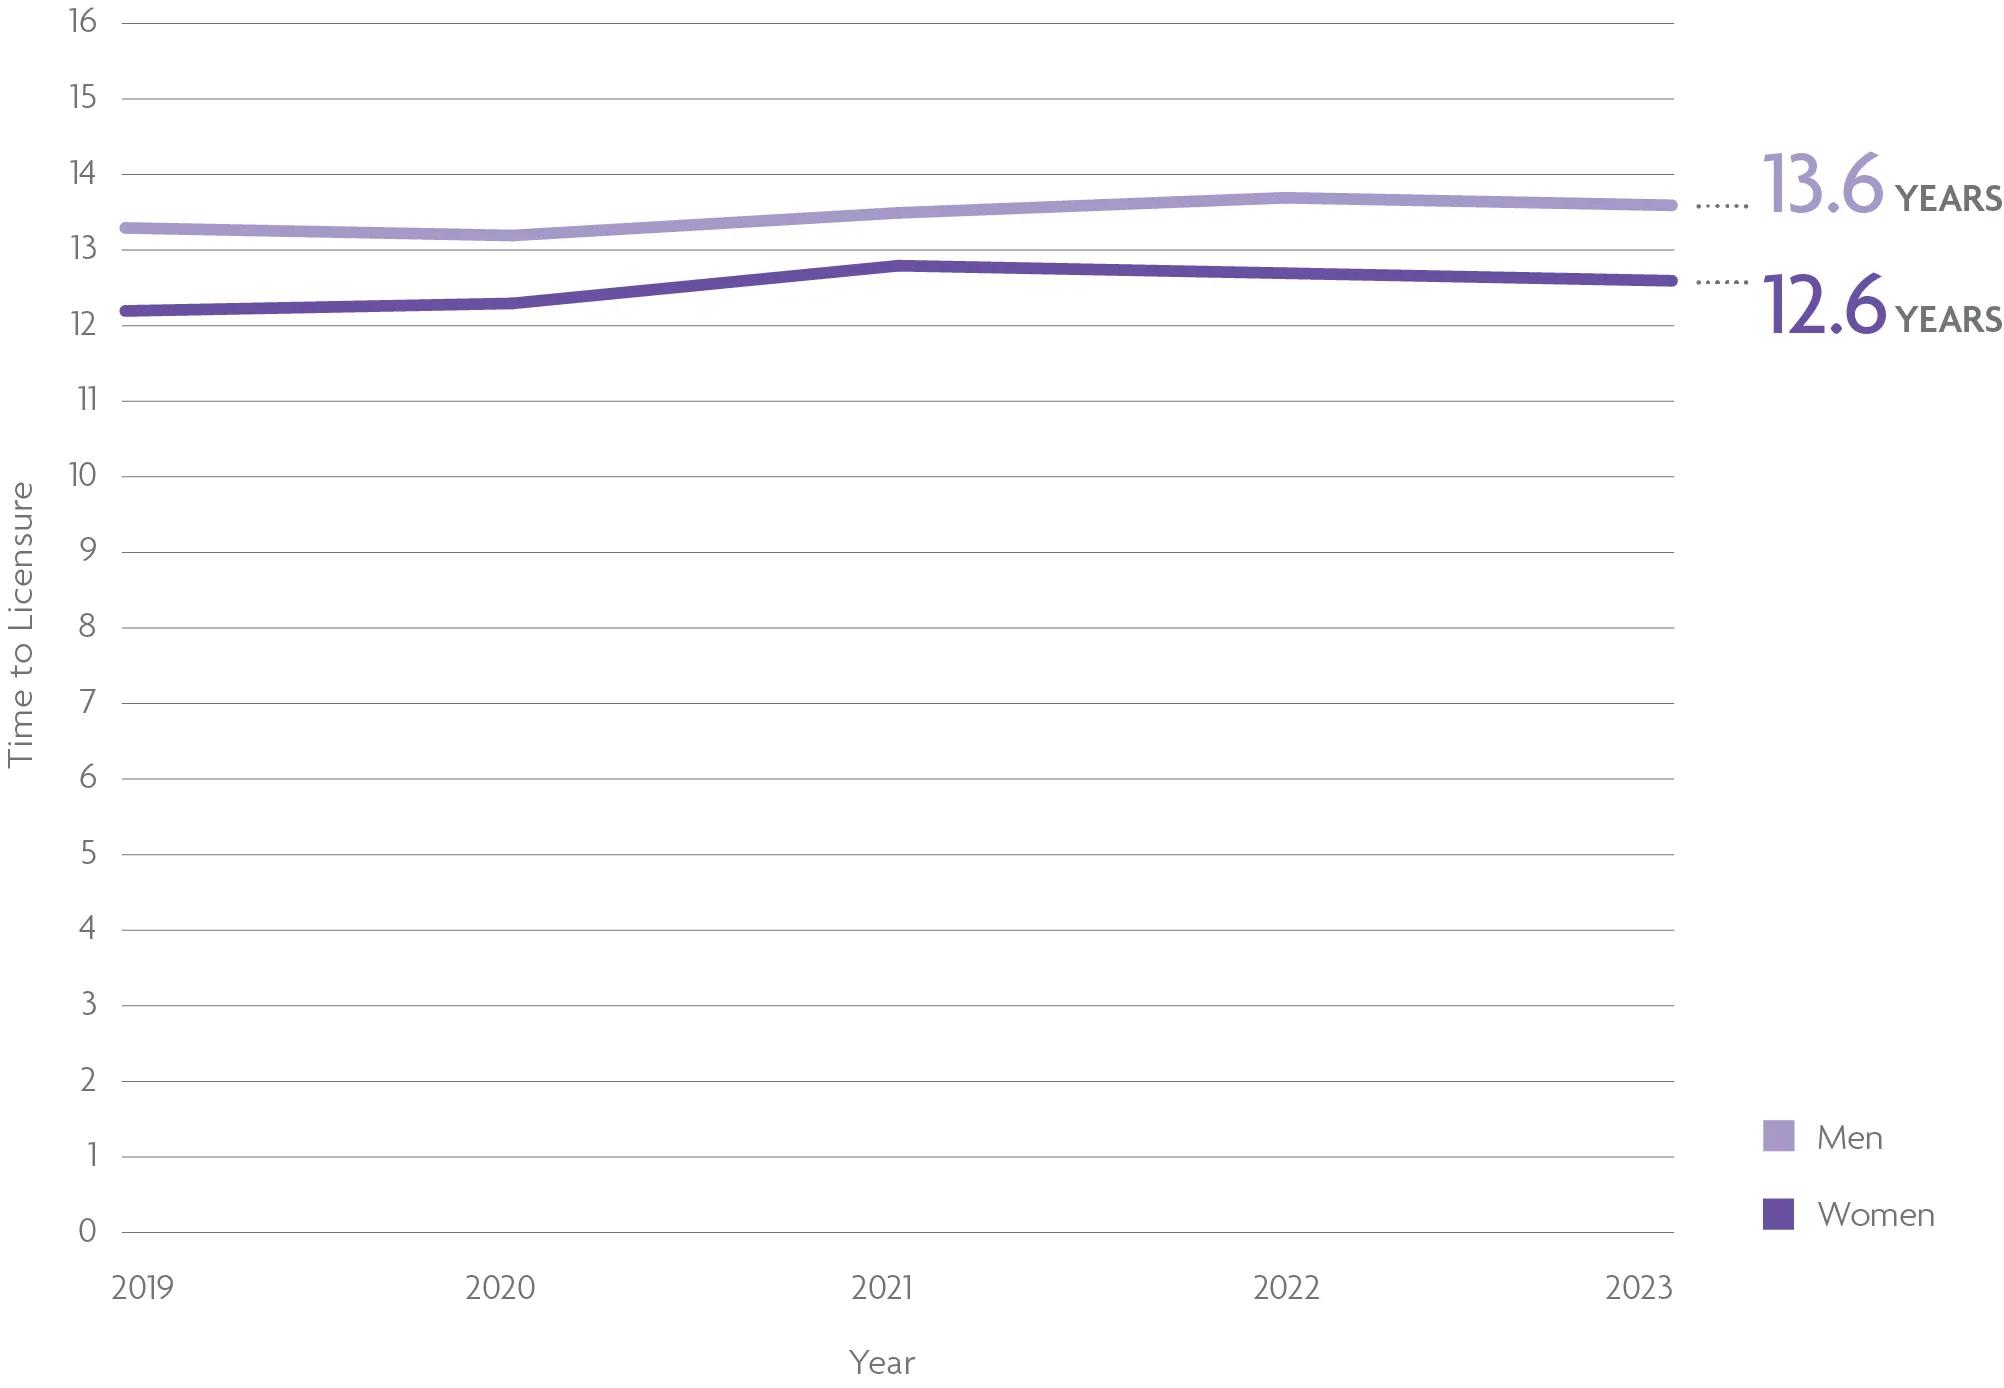
The average woman who completed the licensure process in 2023 took 12.6 years—a year faster than the average man. Over the past 5 years, women have consistently earned their licenses in less time than their male peers.
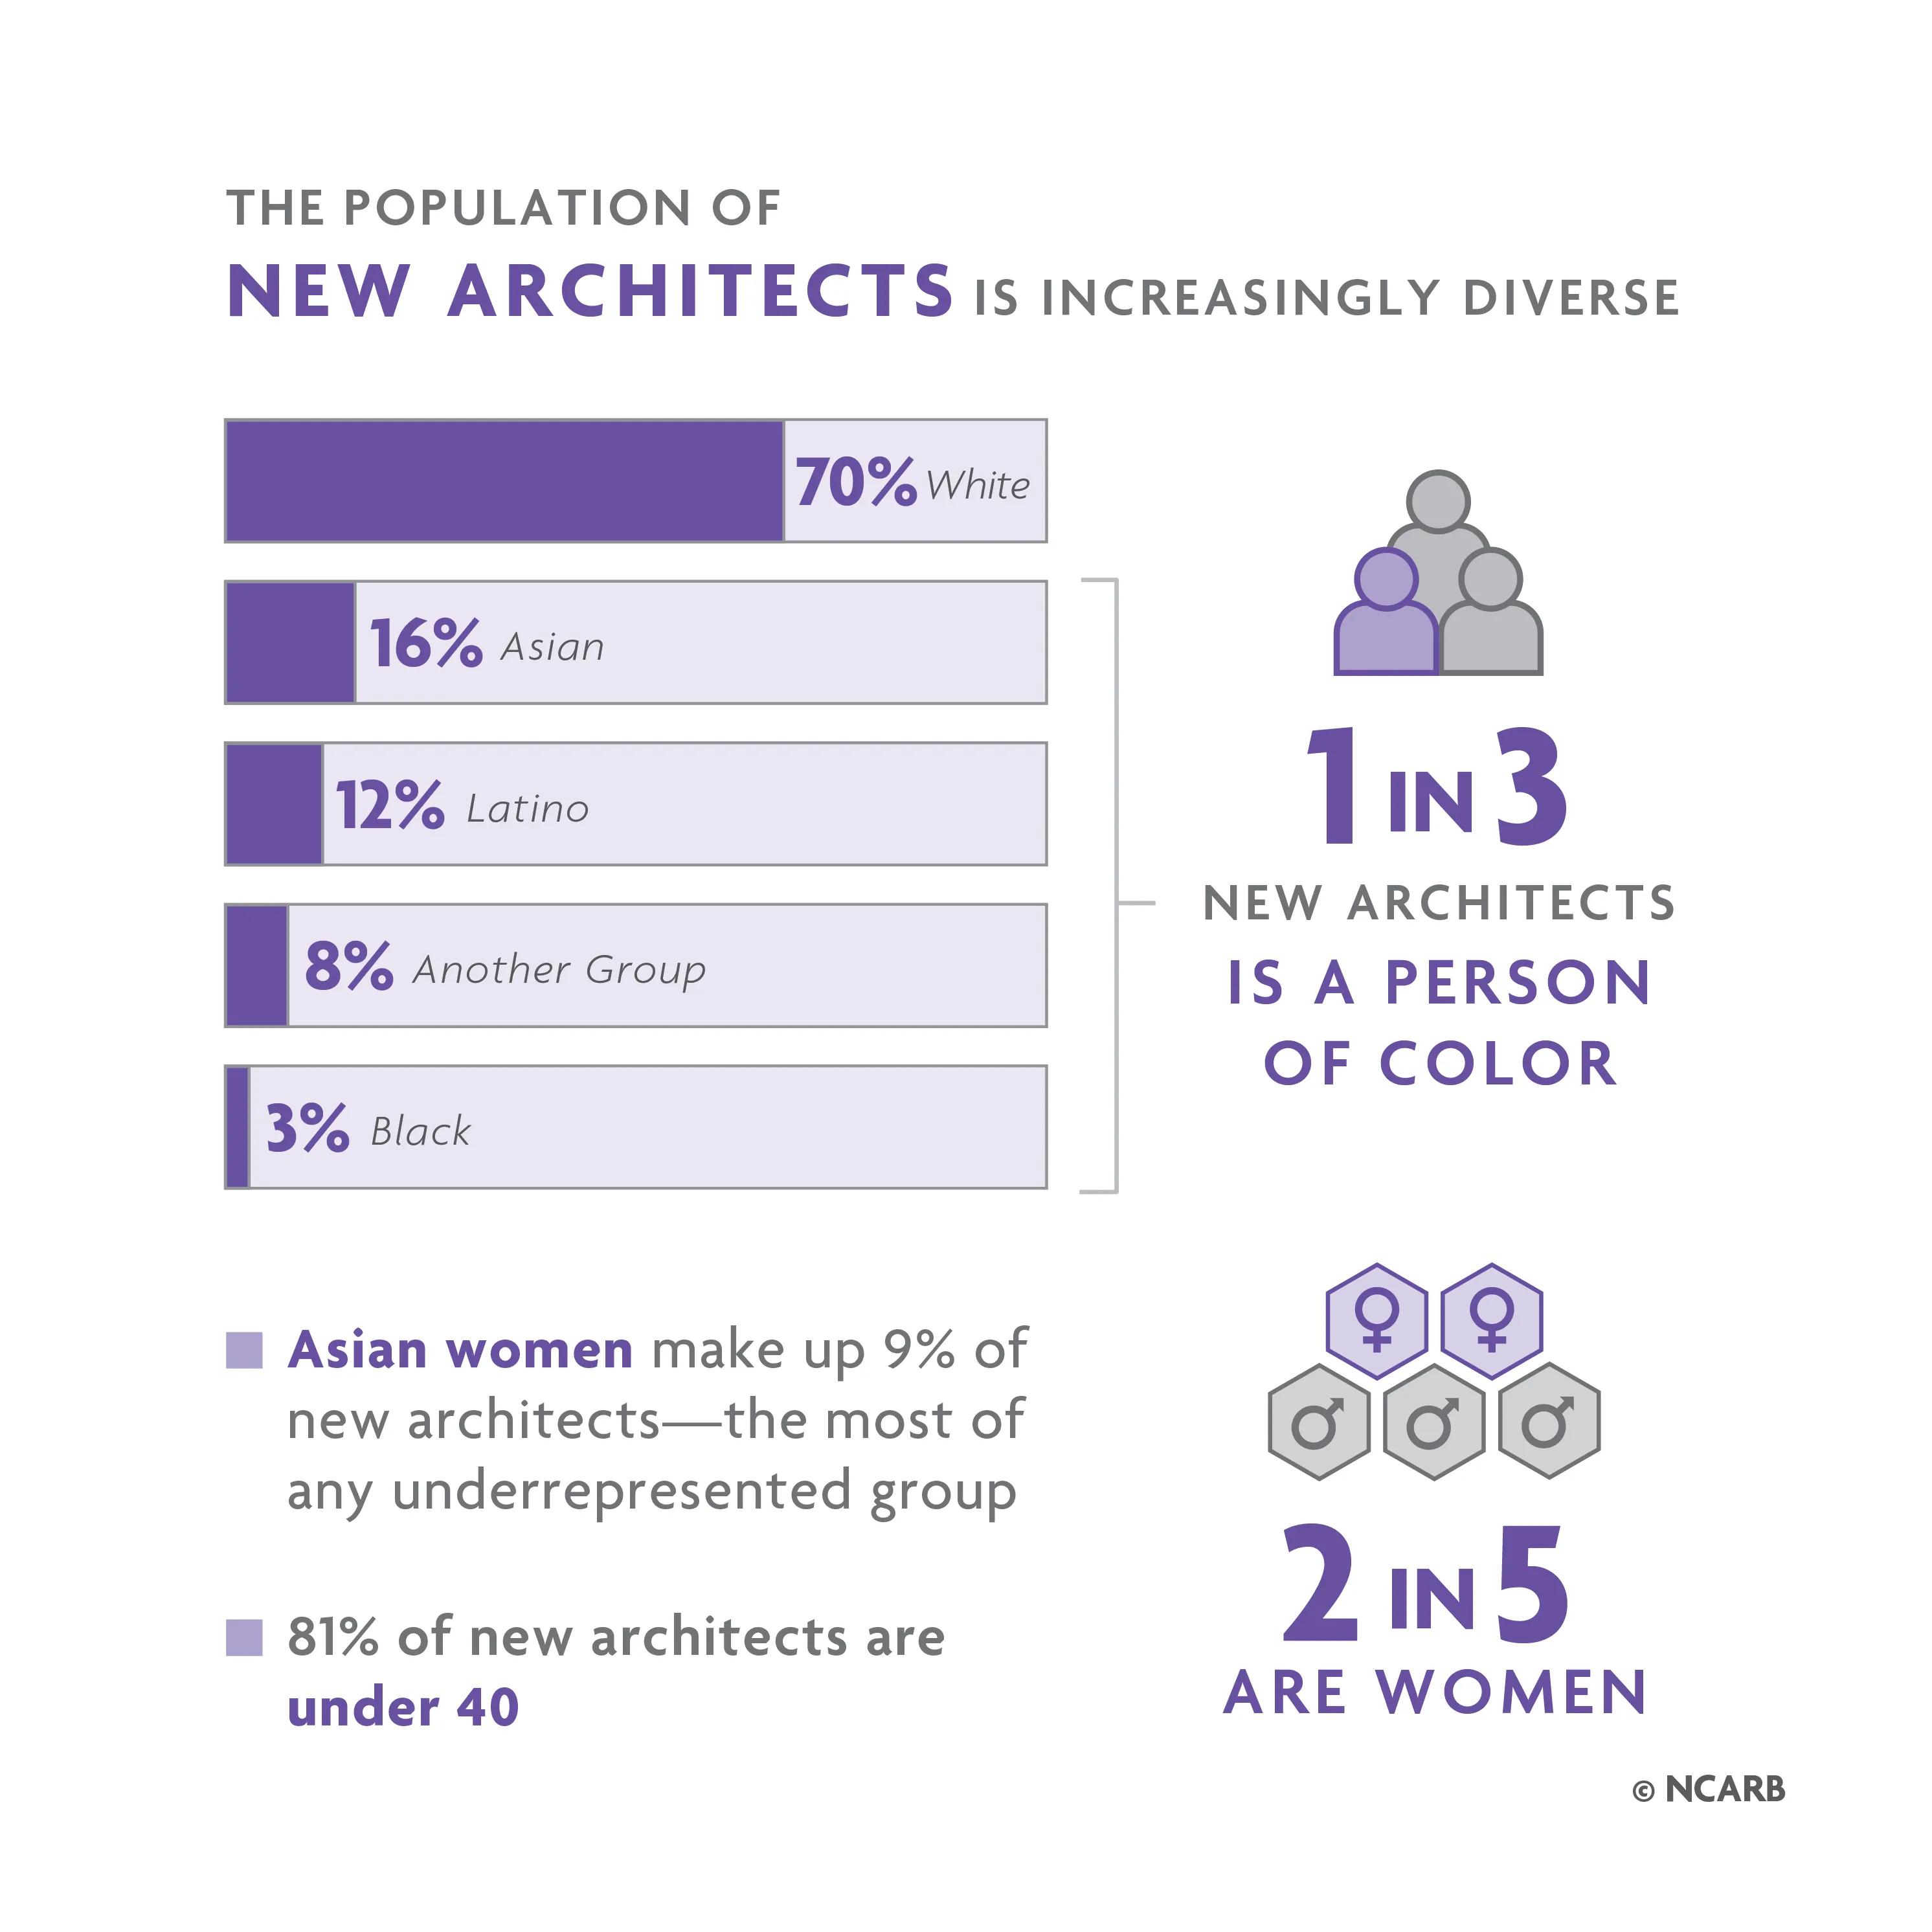
Nearly Half of the Licensure Candidate Population Identifies as a Person of Color
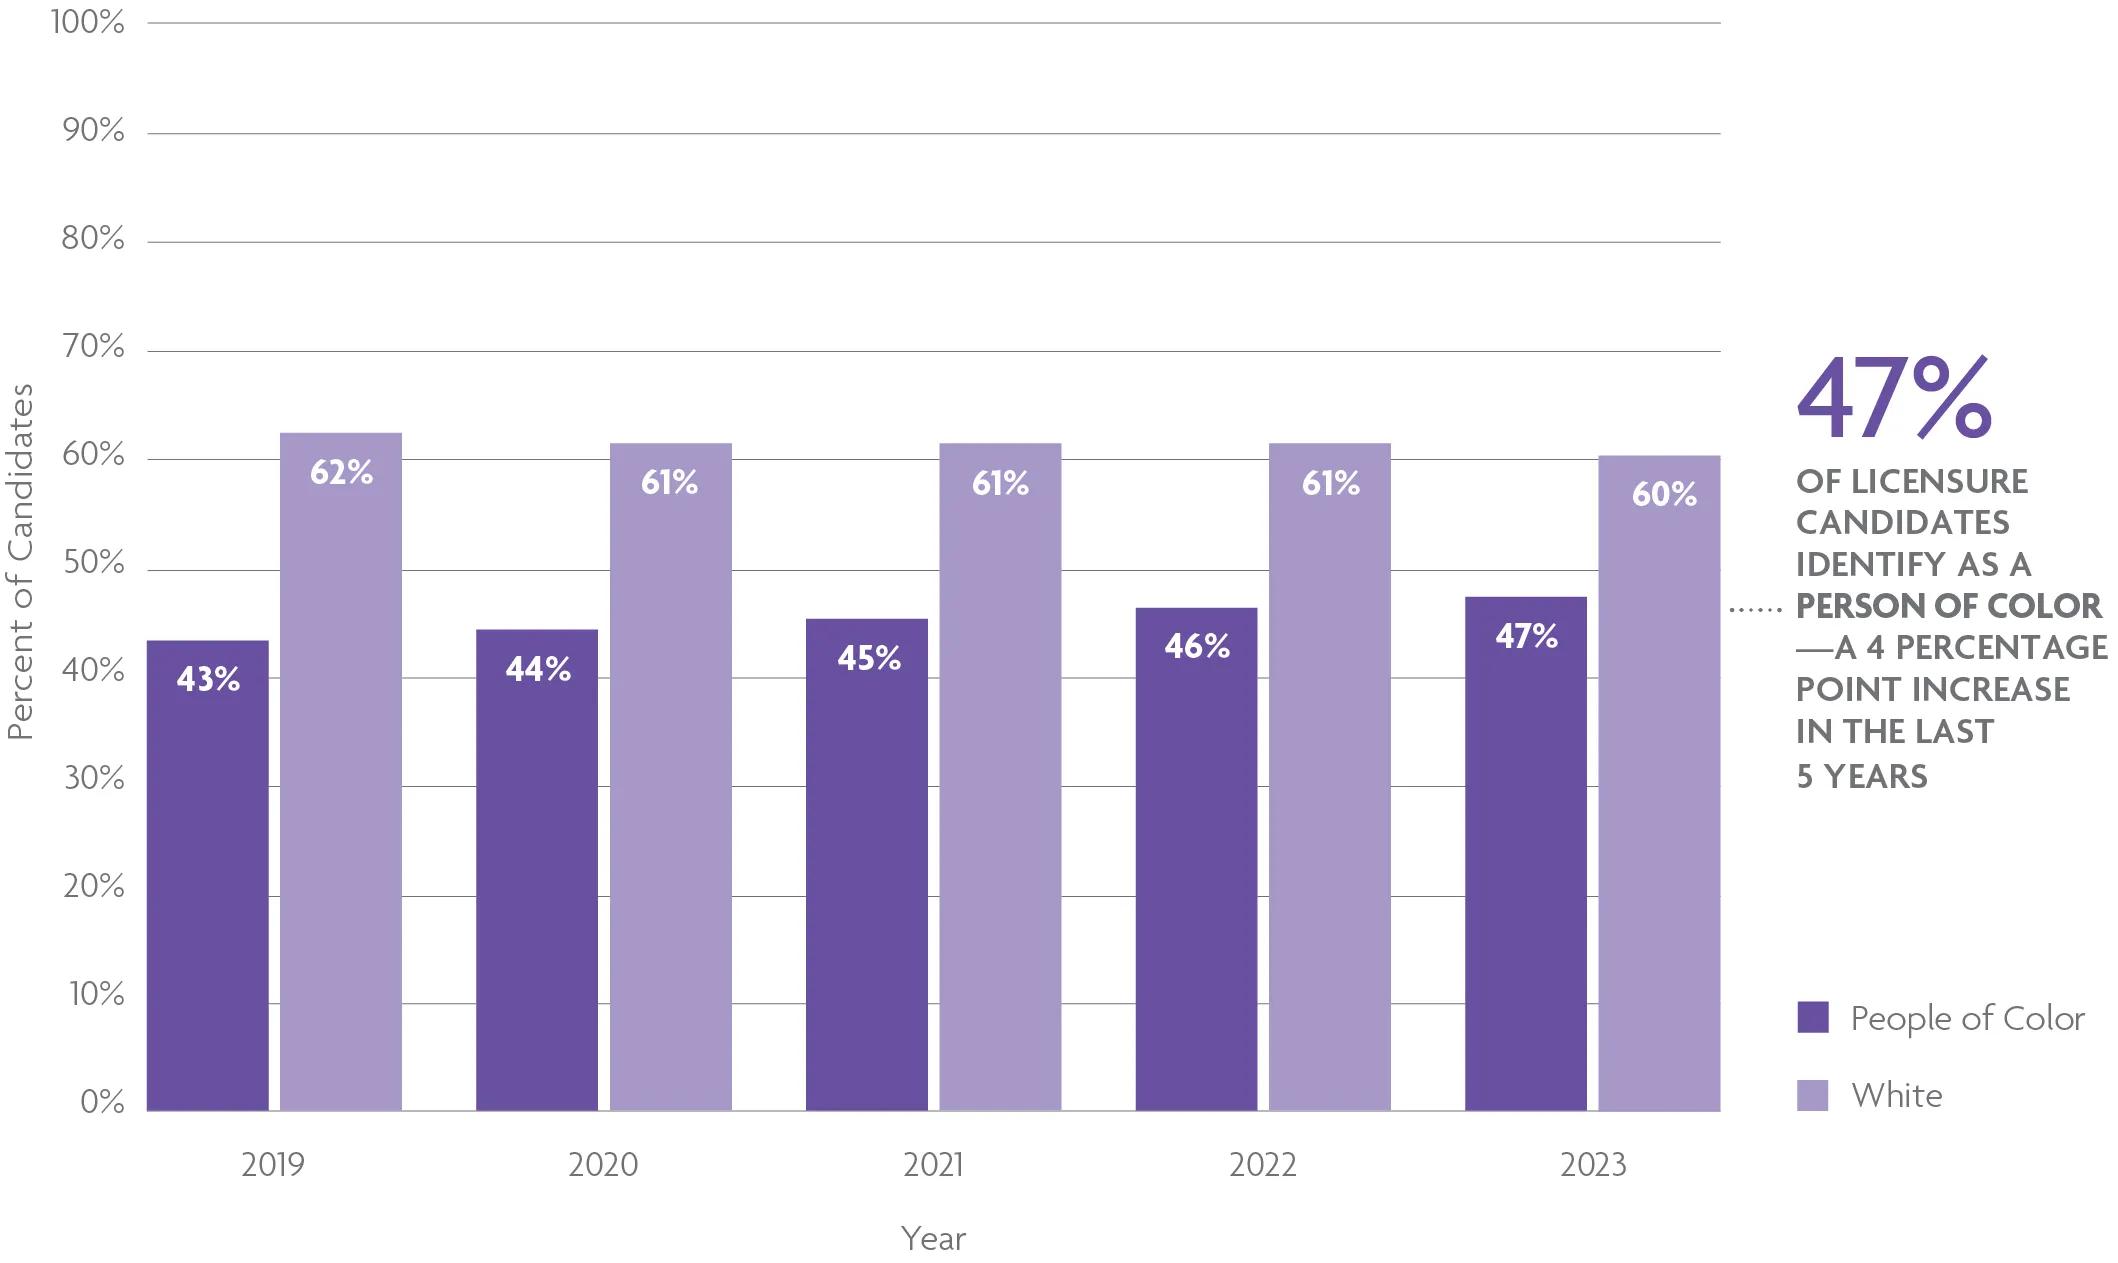
Over the past 5 years, diversity among candidates pursuing licensure has continued to increase. While more than half of licensure candidates identify as white, representing 60% of the population, the population of candidates who identify as people of color has seen a steady increase since 2019. People of color now make up nearly half—47%—of the licensure candidate population. This suggests that diversity in the community of licensed practitioners will increase in the years ahead.
Licensure Candidate Population Nears Gender Parity—46% Are Women
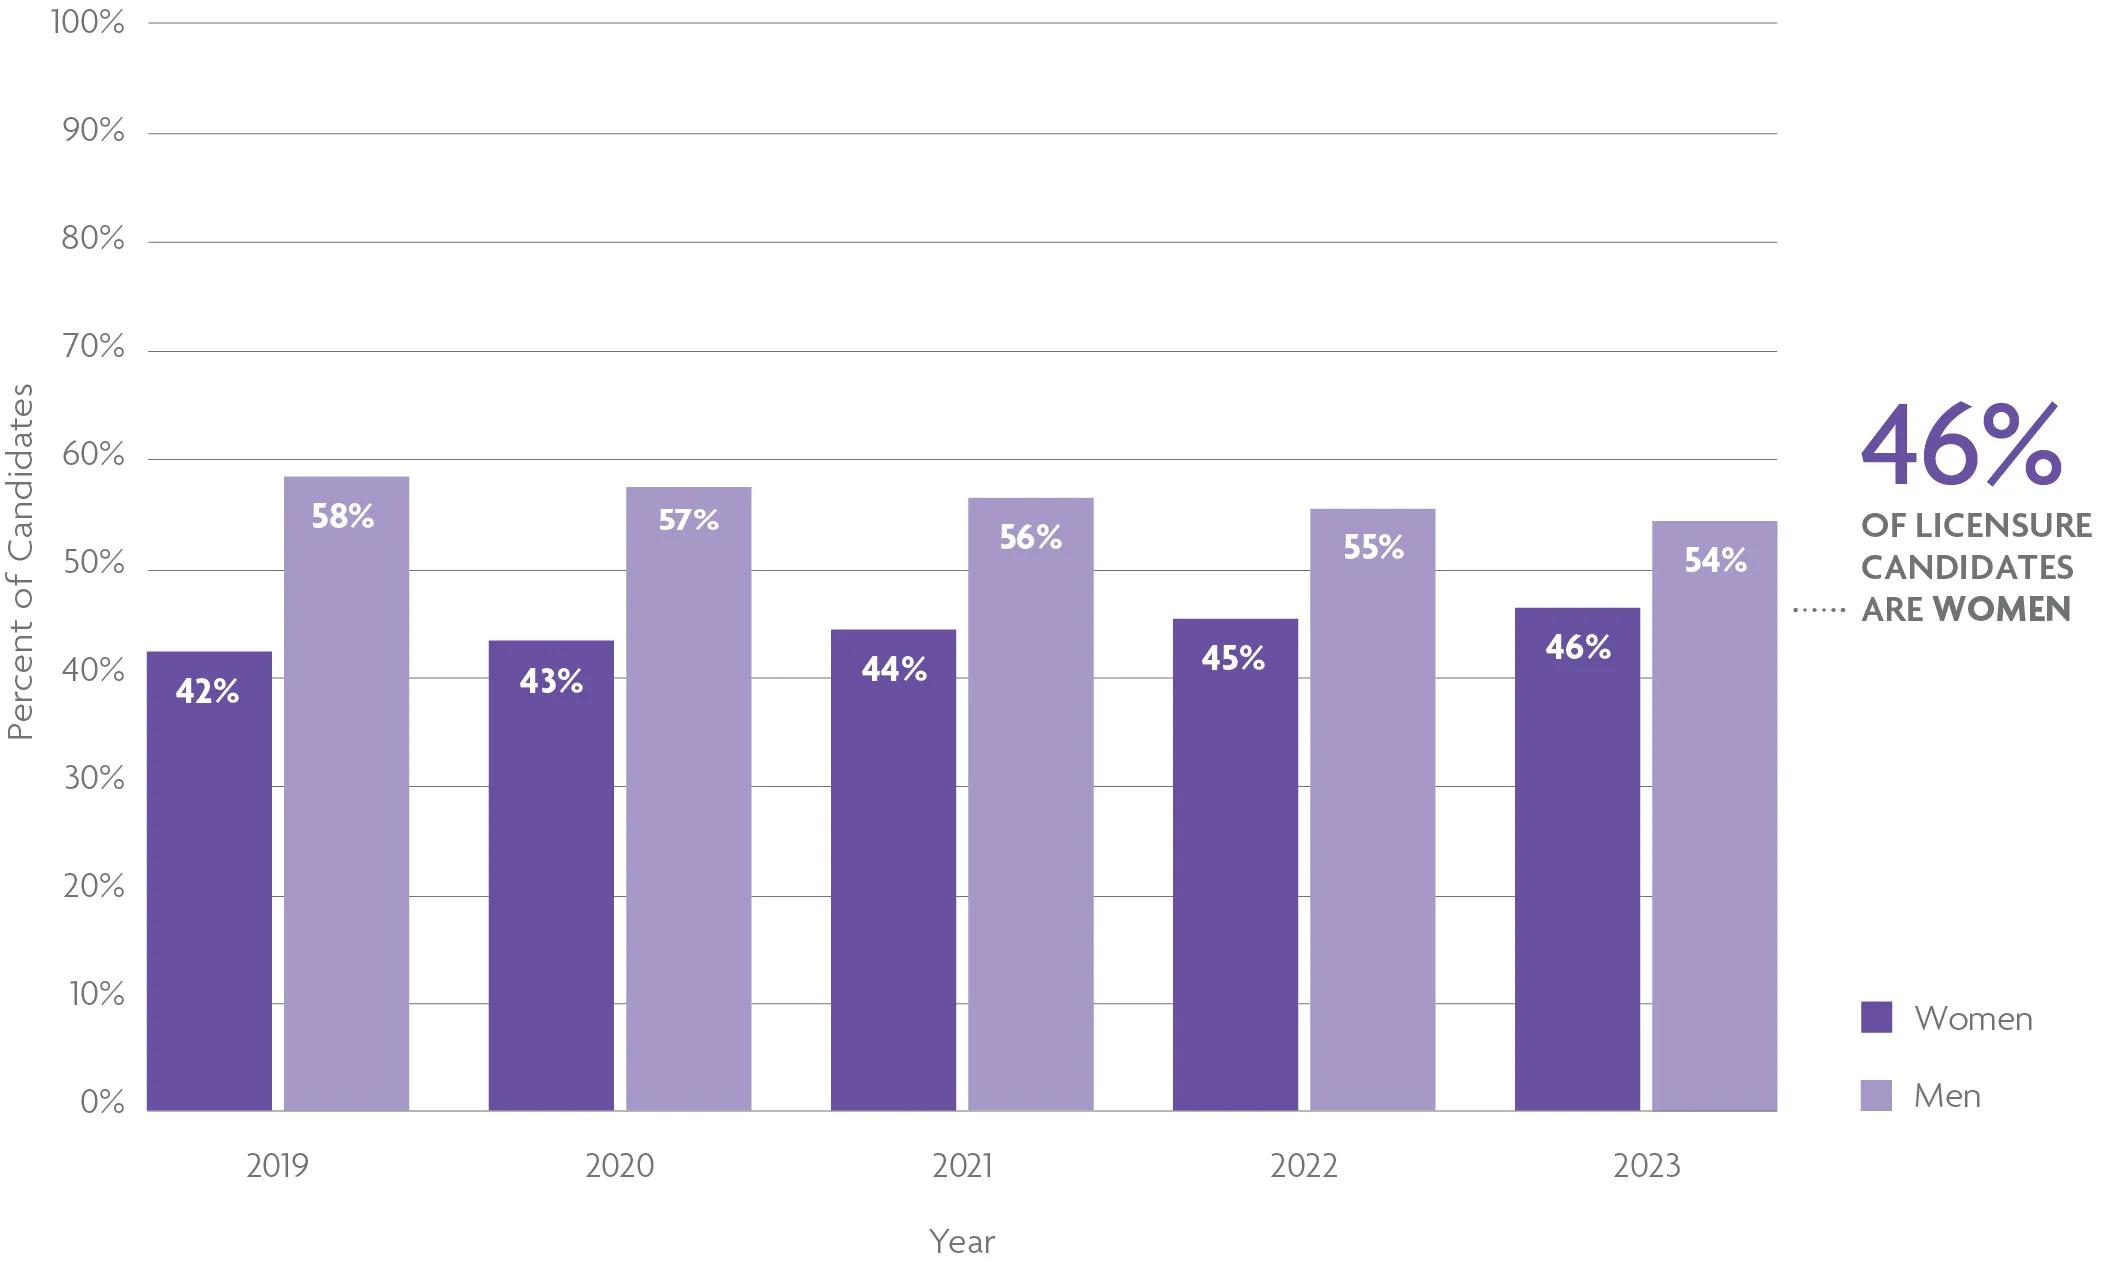
In 2023, 46% of the population of licensure candidates were women—a 4 percentage point increase since 2019. The licensure candidate population has been steadily approaching gender parity over the past decade. This trend reflects the increase in women pursuing careers in the architecture, engineering, and construction industry and also highlights the impact of continuous work to promote greater equity and diversity within the architectural profession.
Currently, less than .05% of licensure candidates have self-identified as non-binary, which is below the threshold that NCARB can visualize in our data reports; however, we hope to expand our gender visualizations once the population of non-binary Record holders crosses our threshold for minimum sample size (which is 30 individuals).

Most Licensure Candidates Who Are POC Identify as Asian or Latino
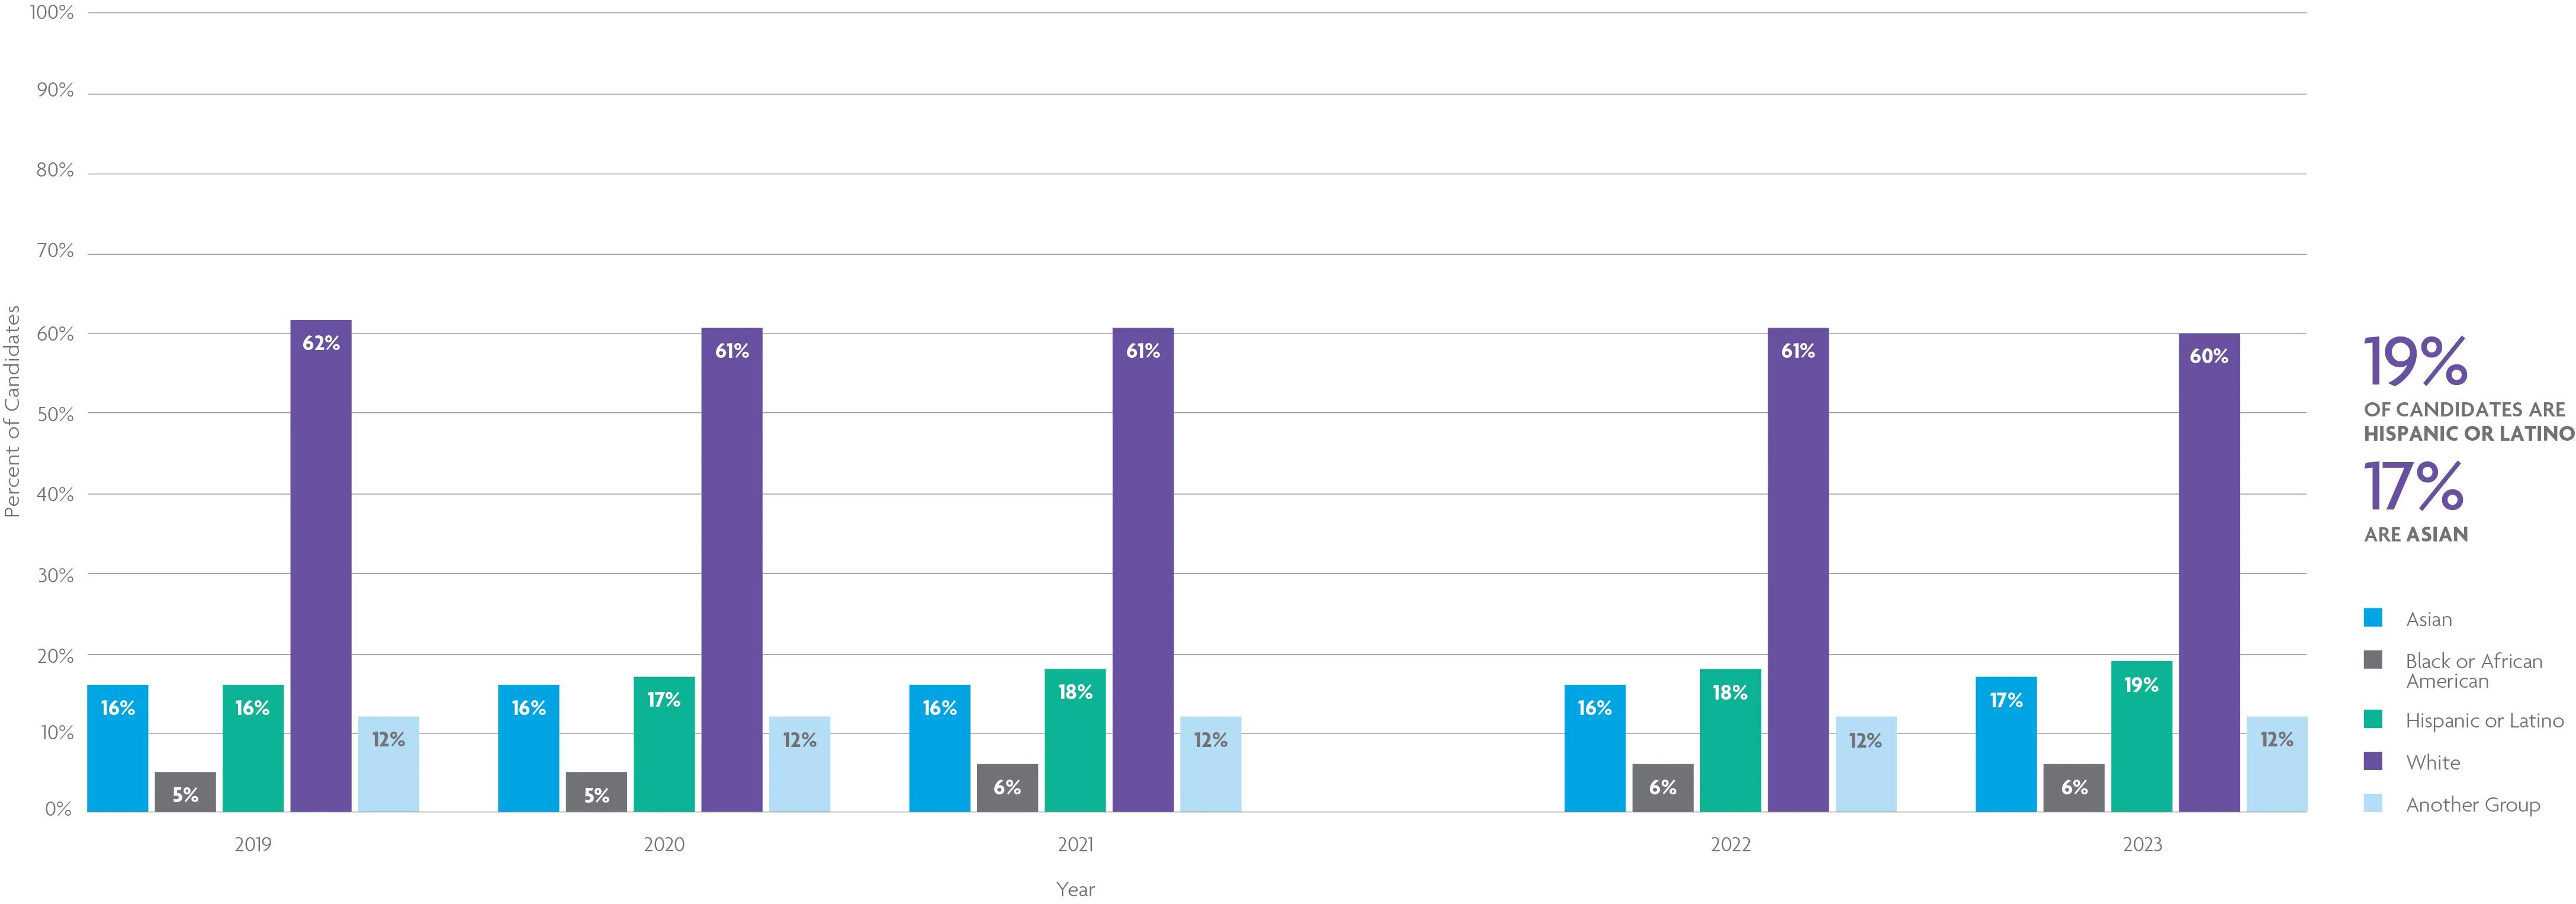
White candidates remain the most represented group, making up 60% of all licensure candidates. However, over the past 5 years, licensure candidates who identify as Hispanic or Latino and Asian have seen continued growth. Hispanic or Latino candidates represented 19% of the population in 2023, a 3 percentage point increase since 2019. Asian candidates made up 17% of total candidate population in 2023, and Black or African American candidates made up 6%—a 1 percentage point increase over the past 5 years for both groups.
Asian Women and Latino Men Are the Most Represented Groups Among POC Licensure Candidates
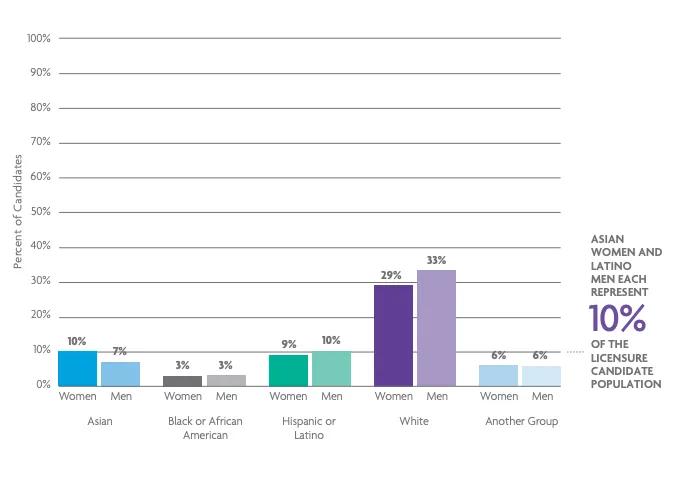
As we continue to push for greater diversity and equity at all levels of the architecture profession, progress is most evident in the licensure candidate population. While white men continue to be the most represented group of licensure candidates, making up 33%, people of color now make up nearly half of the candidate population at 47%. Of candidates of color, Latino men and Asian women were the most represented groups, making up 10% of the population each. Black or African American men and women continue to be one of the most underrepresented groups of the licensure candidate population, comprising 3% each.